Deploy Prometheus as a fully managed service starting at $11/mo. Get automated backups, SSL, updates, and monitoring included.
Prometheus, a Cloud Native Computing Foundation project, is a systems and service monitoring system. It collects metrics from configured targets at given intervals, evaluates rule expressions, displays the results, and can trigger alerts when specified conditions are observed.
Deploy Prometheus fully managed in minutes on any cloud provider. Free to start.


 On-Premise
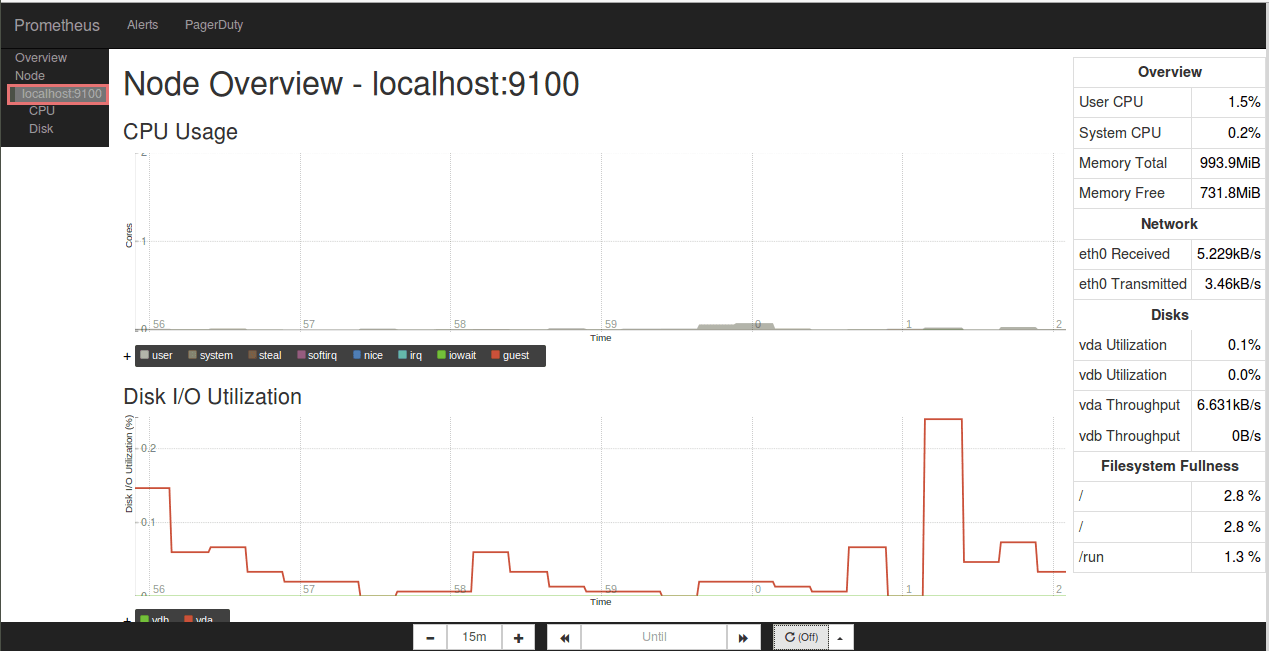
Explore Prometheus in action
See how Prometheus works and what you can do with it.
Prometheus features & resources
Data model
Prometheus fundamentally stores all data as time series: streams of timestamped values belonging to the same metric and the same set of labeled dimensions. Besides stored time series, Prometheus may generate temporary derived time series as the result of queries.
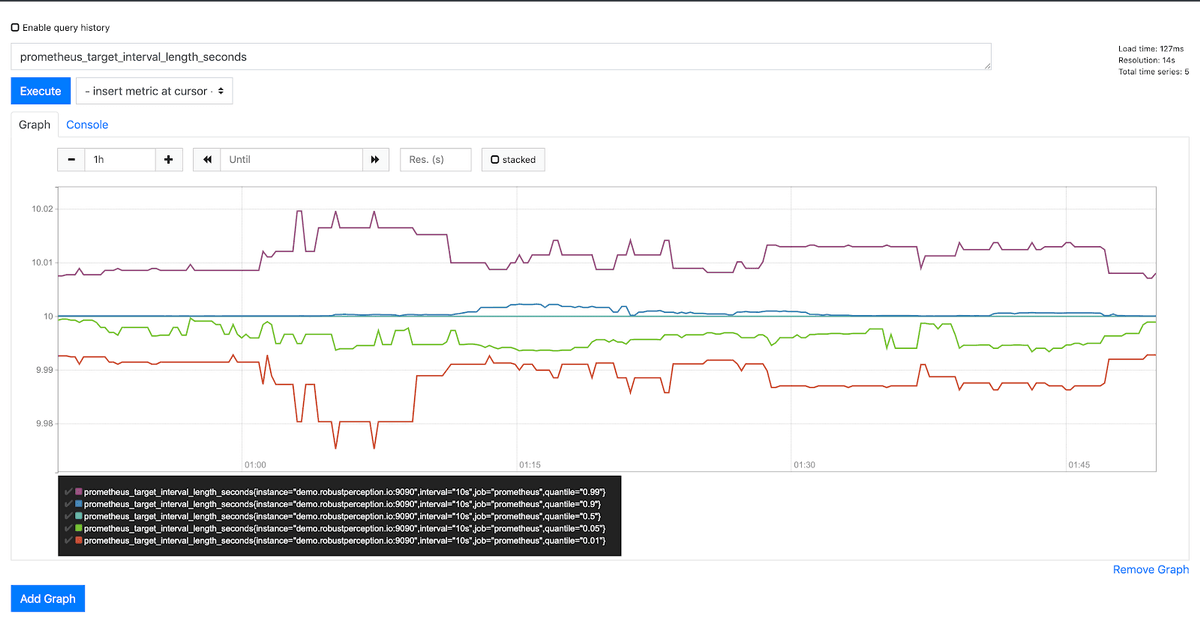
Querying prometheus
Prometheus provides a functional query language called PromQL (Prometheus Query Language) that lets the user select and aggregate time series data in real time. The result of an expression can either be shown as a graph, viewed as tabular data in Prometheus's expression browser, or consumed by external systems via the HTTP API.
Grafana support for prometheus
Grafana supports querying Prometheus. The Grafana data source for Prometheus is included since Grafana 2.5.0 (2015-10-28). The following shows an example Grafana dashboard which queries Prometheus for data:
Configuration
Prometheus is configured via command-line flags and a configuration file. While the command-line flags configure immutable system parameters (such as storage locations, amount of data to keep on disk and in memory, etc.), the configuration file defines everything related to scraping jobs and their instances, as well as which rule files to load.
Benefits of Prometheus fully managed by Elestio
Deploy a fully managed instance of Prometheus in few minutes on Elestio. We handle installation, configuration, encryption, security, backups, live monitoring, software & OS updates. No more DevOps.
Dedicated Hardware
We deliver all services on dedicated virtual machines: you get full access to the underlying resources and kernel-level security.
Dedicated VMsAutomated Updates
Let's save your business a lot of hassle, whilst ensuring that you get the performance and security benefits of regularly updated software and systems.
Always up-to-datePredictable pricing
A guaranteed monthly price covers everything: compute, storage, bandwidth, updates, security & maintenance.
All-inclusiveNo vendor lock-in
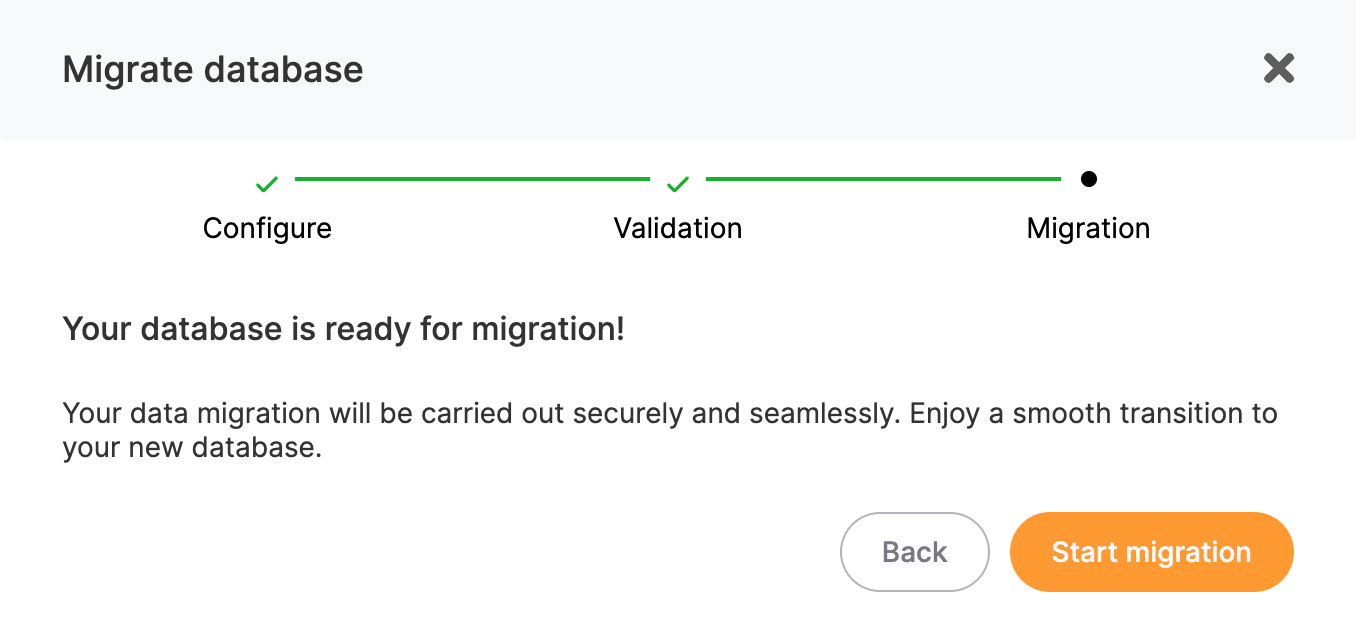
You can migrate your software and data to any cloud providers any time you want. With Elestio you are totally free and in control.
Full freedomCompliance
We are SOC2, and GDPR compliant. We are committed to protecting your data and privacy.
SOC2 + GDPRGlobal Availability
Deploy close to your users with support for multiple cloud providers and on-premise options. Elestio ensures low-latency and high-performance anywhere in the world.
Multi-cloudReviews
Trusted by 10,000+ Developers Worldwide
Real reviews from real users on Trustpilot.
"I'm in the IT industry for over 25 years and Elestio stands out in many ways. The managed services are top-notch, support is incredibly fast, and the platform just works. Couldn't be better!"
Frequently asked questions
There are the most commonly asked questions about Elestio.
Can't find what you're looking for?
Ask us directly!
-
How does Elestio charge me?
-
What type of support does Elestio offer?
-
Which cloud providers does Elestio use?
-
Can I install more than one software on the same VM?
-
Where can I deploy my services?
-
Where does Elestio store my data?
-
Can I deploy Elestio services on-premise or on my existing cloud infrastructure?
-
Can my software services communicate between different cloud providers safely?
-
Is it possible to restrict access to my virtual machine (with a firewall)?
-
Can I migrate/clone my service to another cloud or region?
Ready to deploy Prometheus?
Join thousands of developers who trust Elestio for fully managed hosting. Up and running in minutes, on any cloud.