Deploy Rstudio as a fully managed service starting at $16/mo. Get automated backups, SSL, updates, and monitoring included.
RStudio is a powerful and easy way to interact with R programming, considered as Integrated Development Environment (IDE) that provides a one-stop solution for all the statistical computing and graphics. The RStudio is a more advanced version of R that comes with a multi-pane window setup that provides access to all primary things on a single screen (such as source, console, environment & history, files, photos, graphs, etc).
Deploy Rstudio fully managed in minutes on any cloud provider. Free to start.


 On-Premise
Explore Rstudio in action
See how Rstudio works and what you can do with it.
Rstudio features & resources
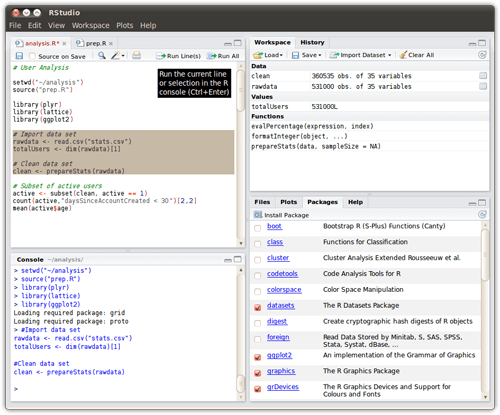
RStudio is designed to make it easy to write scripts
As soon as you create a new script, the windows within your RStudio session adjust automatically so you can see both your script and the results in your console when you run your syntax. Even better is the ability to call up potential syntax options while you are writing just by using the tab key.
RStudio makes it convenient to view and interact with the objects stored in your environment
In the basic R GUI, you can always list the objects you have stored in your environment. But RStudio has a very useful “Environment” window available. This shows all of the objects that you have stored, including data; scalars, vectors, and matrices; model outputs; etc., along with a summary of the information that is stored in those objects.
Reproducible research
You’ve loaded your data on your experimental patients into SPSS, rearranged it as needed, inspected the summary statistics, deleted several cases with missing values, run the model, and observed some very strange results. You suspect there was a mistake in your data analysis process and want to discuss this issue with your colleague.
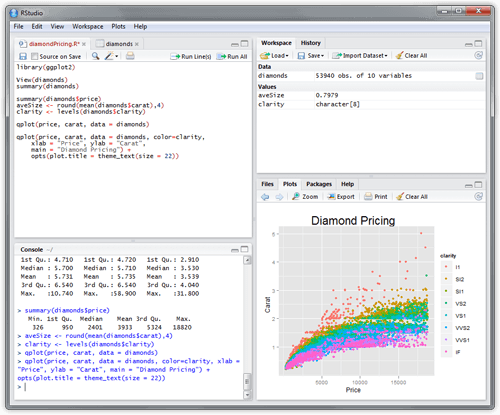
Advanced visualizations
Even the basic functionality of R allows you to create histograms, scatterplots, or line plots with only a tiny bit of code. These are very convenient functions for visualizing your data before even starting any analysis. In a few seconds you can actually see your data and get insights that are not visible from the tabulated data alone.
Benefits of Rstudio fully managed by Elestio
Deploy a fully managed instance of Rstudio in few minutes on Elestio. We handle installation, configuration, encryption, security, backups, live monitoring, software & OS updates. No more DevOps.
Dedicated Hardware
We deliver all services on dedicated virtual machines: you get full access to the underlying resources and kernel-level security.
Dedicated VMsAutomated Updates
Let's save your business a lot of hassle, whilst ensuring that you get the performance and security benefits of regularly updated software and systems.
Always up-to-datePredictable pricing
A guaranteed monthly price covers everything: compute, storage, bandwidth, updates, security & maintenance.
All-inclusiveNo vendor lock-in
You can migrate your software and data to any cloud providers any time you want. With Elestio you are totally free and in control.
Full freedomCompliance
We are SOC2, and GDPR compliant. We are committed to protecting your data and privacy.
SOC2 + GDPRGlobal Availability
Deploy close to your users with support for multiple cloud providers and on-premise options. Elestio ensures low-latency and high-performance anywhere in the world.
Multi-cloudReviews
Trusted by 10,000+ Developers Worldwide
Real reviews from real users on Trustpilot.
"I'm in the IT industry for over 25 years and Elestio stands out in many ways. The managed services are top-notch, support is incredibly fast, and the platform just works. Couldn't be better!"
Frequently asked questions
There are the most commonly asked questions about Elestio.
Can't find what you're looking for?
Ask us directly!
-
How does Elestio charge me?
-
What type of support does Elestio offer?
-
Which cloud providers does Elestio use?
-
Can I install more than one software on the same VM?
-
Where can I deploy my services?
-
Where does Elestio store my data?
-
Can I deploy Elestio services on-premise or on my existing cloud infrastructure?
-
Can my software services communicate between different cloud providers safely?
-
Is it possible to restrict access to my virtual machine (with a firewall)?
-
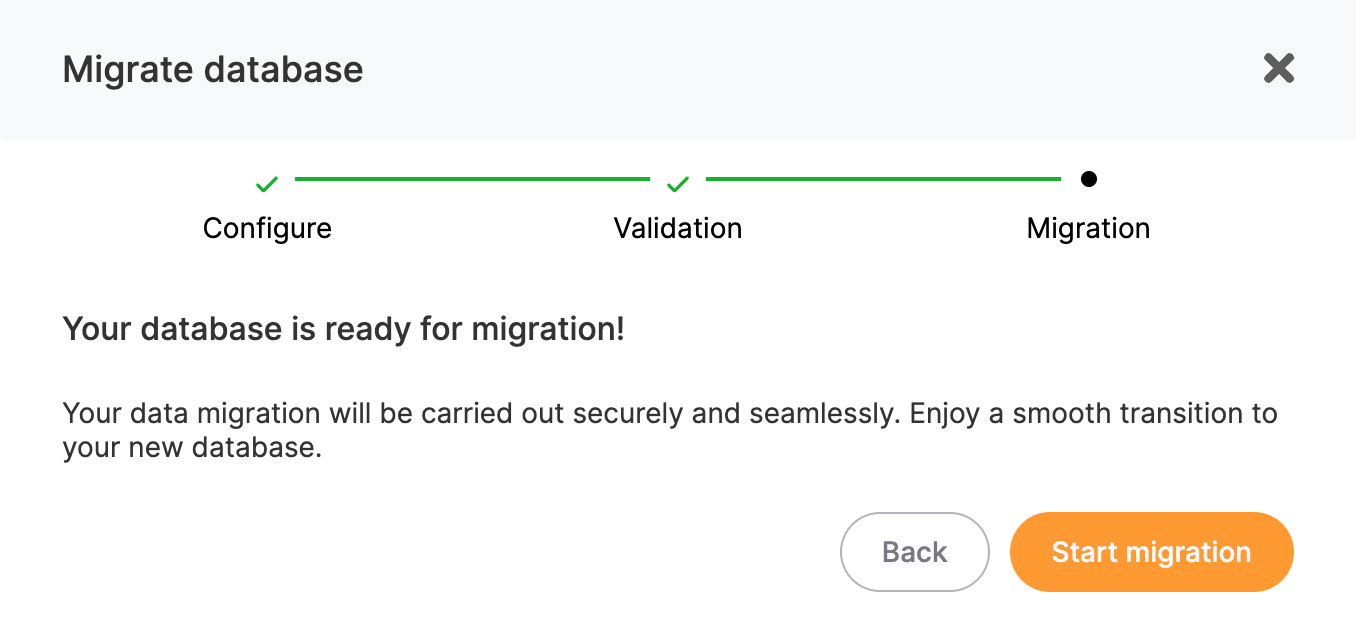
Can I migrate/clone my service to another cloud or region?
Ready to deploy Rstudio?
Join thousands of developers who trust Elestio for fully managed hosting. Up and running in minutes, on any cloud.