ClickHouse is an open-source column-oriented database management system (DBMS) designed for online analytical processing (OLAP). It enables users to generate real-time analytical reports by executing SQL queries on large datasets. It has storage and query execution mechanisms and handles high volume, time-series data and provides performance for analytical workloads.
Sign In
On your first visit to the site, you will be presented with the login/signup screen.
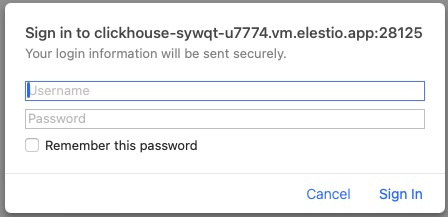
When your instance is first created, an account is created for you with the email you chose. You can get the password for this account by going to your Elestio dashboard and clicking on the "Show Password" button.
Enter your username and password and click the "Sign In" button.
Databases
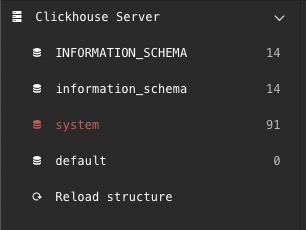
In ClickHouse, databases are logical containers that hold tables, views, and other database objects. They provide a way to organize and manage data within the system. Each database has its own set of tables and can have its own set of users with different access privileges. Databases in ClickHouse are created using SQL statements and can be used to store and query data efficiently for analytical processing. By default there are two databases: default and system.
SQL
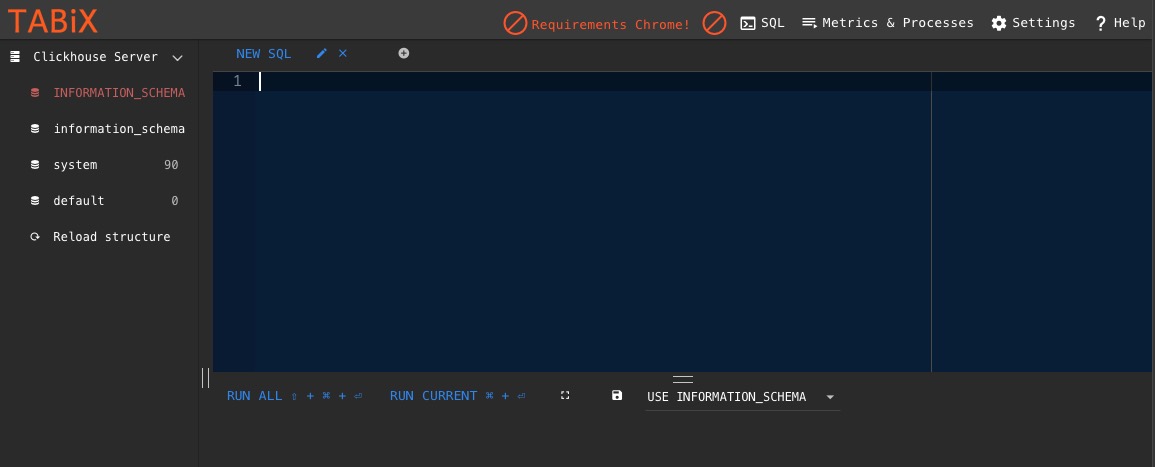
SQL stands for Structured Query Language, which is a standard language for managing and manipulating relational databases. ClickHouse supports a subset of SQL syntax, allowing users to perform various operations such as querying, inserting, updating, and deleting data in the database. SQL in ClickHouse enables users to write queries to analyze and process large datasets efficiently using features like aggregations, joins, and window functions. You can access the SQL editor by clicking on the "SQL" tab in the top navigation bar. To select a database to perform operations on, use the USE <database name> from the dropdown or simple double click on the database name from the left hand menu.
Processes
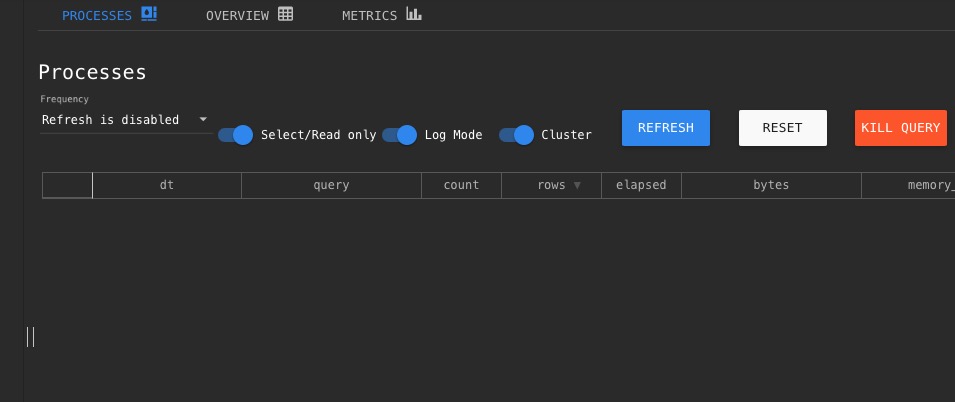
Process refers to the execution of queries and operations on the database. It involves the handling of data, executing SQL queries, and performing various operations such as aggregations, joins, and window functions. The process in ClickHouse is responsible for efficiently processing and analyzing large datasets in real-time to generate analytical reports. You can choose to toggle options to fit your needs like select read only mode, log mode or cluster mode along with different refresh rates and option to kill queries or reset the processes.
Overview
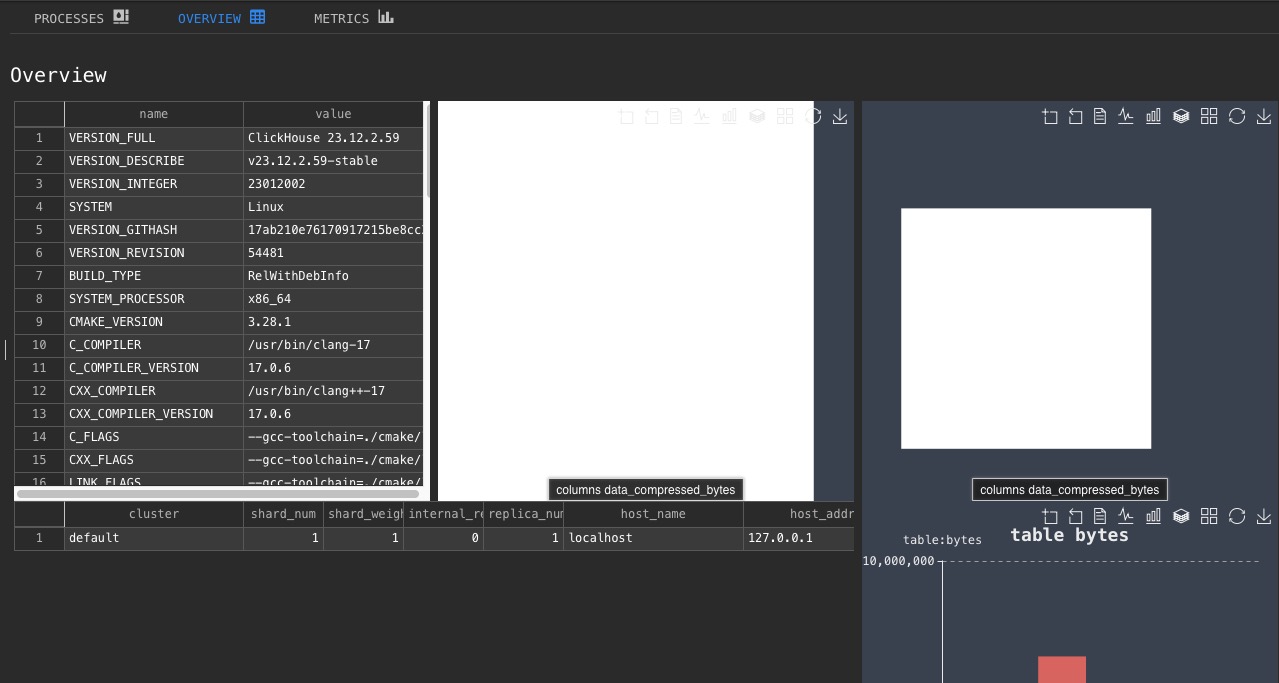
Overview is a section that provides a high-level summary or snapshot of the database system. It includes information such as system status, resource usage, cluster health, and other relevant metrics. The overview screen helps users quickly assess the overall health and performance of the ClickHouse database and identify any potential issues or bottlenecks. You also get several graphs and charts to help you visualize the data. This information be helpful when troubleshooting problems with your database or when trying to understand how it is performing under different conditions.
Metrics
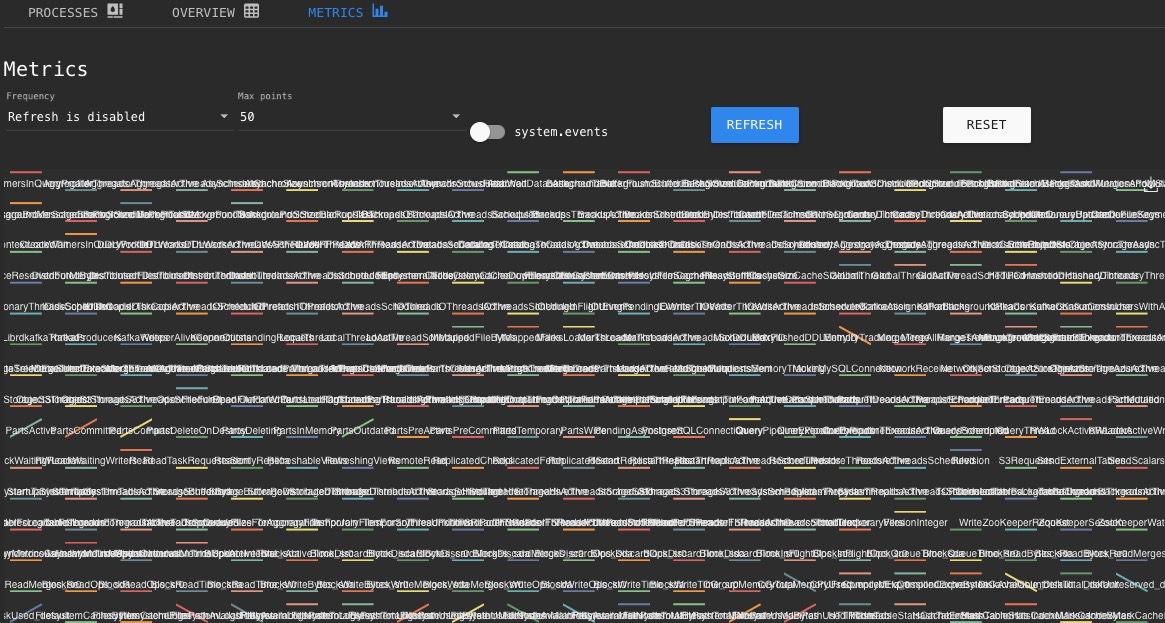
In ClickHouse, metrics are values that can be calculated instantly or have a current value. They provide information about various aspects of the database system, such as the number of simultaneously processed queries or the current replica delay. These metrics are stored in a table that is always up to date. The table contains columns for the metric name, metric value, metric description, and an alias for the metric.
Preferences & Settings
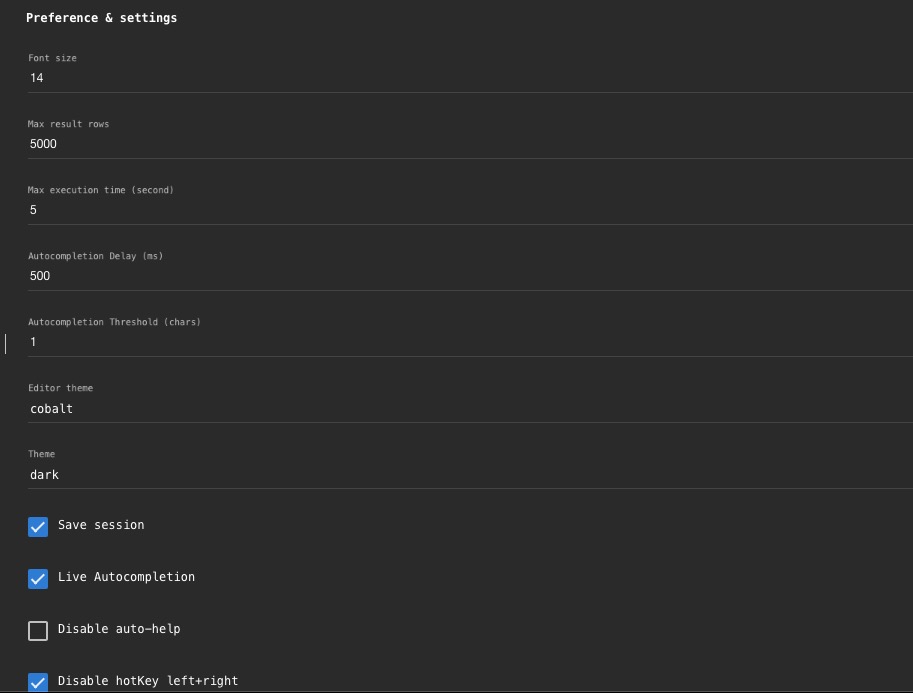
Settings and Preferences allow you to customize your ClickHouse experience. You can change the theme, toggle dark mode, change the font size, and more. Additionally, you can configure autocompletions, delays, maximum number of result rows, and editor themes. These settings can be accessed by clicking on the "Settings" option located in the top right corner of the screen.
