Grafana is a tool for monitoring and observing data. It helps users see and analyze information from different sources easily. Grafana lets you make simple and customizable dashboards to look at data and understand how systems are doing. It works with many types of data sources, making it useful for organizations to monitor their systems.
Login
On your first visit to the site, you will be presented with the login/signup screen.
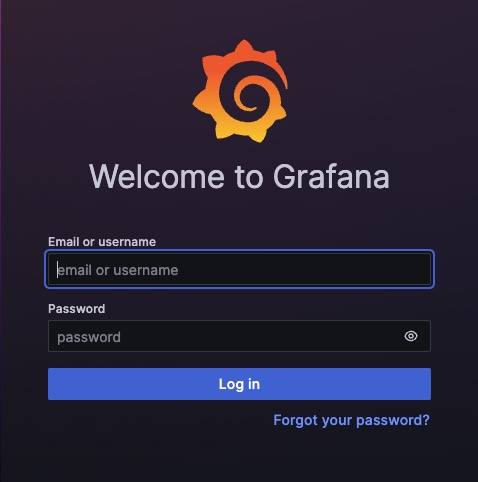
When your instance is first created, an account is created for you with the email you chose. You can get the password for this account by going to your Elestio dashboard and clicking on the "Show Password" button.
Enter your email, name and password and click the "Login" button
Dashboard
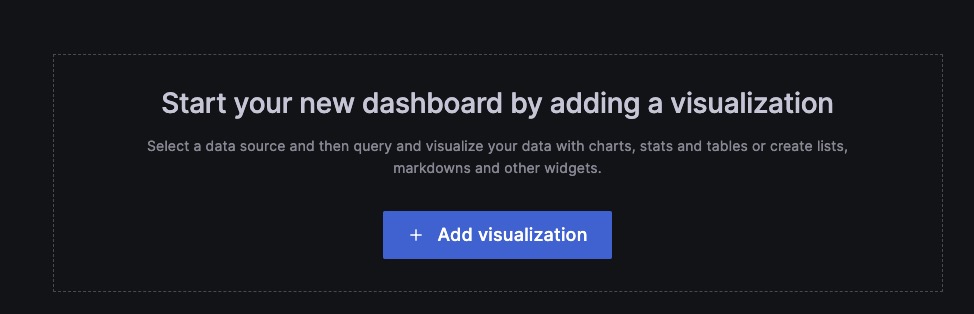
Dashboard is a visual representation of data that allows you to monitor and analyze metrics, logs, and other information in real-time. It consists of panels that display different types of data, such as graphs, tables, and gauges. Dashboards in Grafana can be customized and configured to suit your specific monitoring needs. You can create new dashboards by clicking on the "Add Visualization" button.
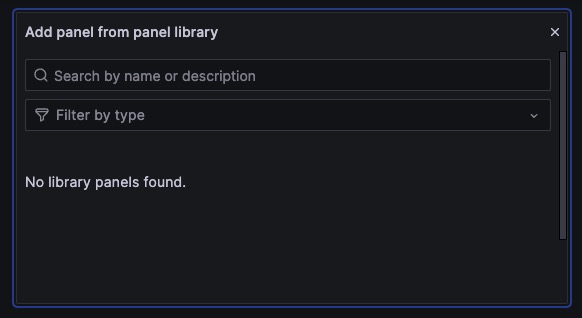
Adding Panel From Panel Library
A panel in Grafana is a visual element that displays data in various formats, such as graphs, tables, and gauges. It is a fundamental building block of a Grafana dashboard and allows you to visualize and analyze metrics, logs, and other information in real-time. Panels can be customized and configured to suit your specific monitoring needs. Panels are useful for displaying data from different sources, such as Prometheus, InfluxDB, and Elastic search. You can create new panels by clicking on the "Add Panel" button.
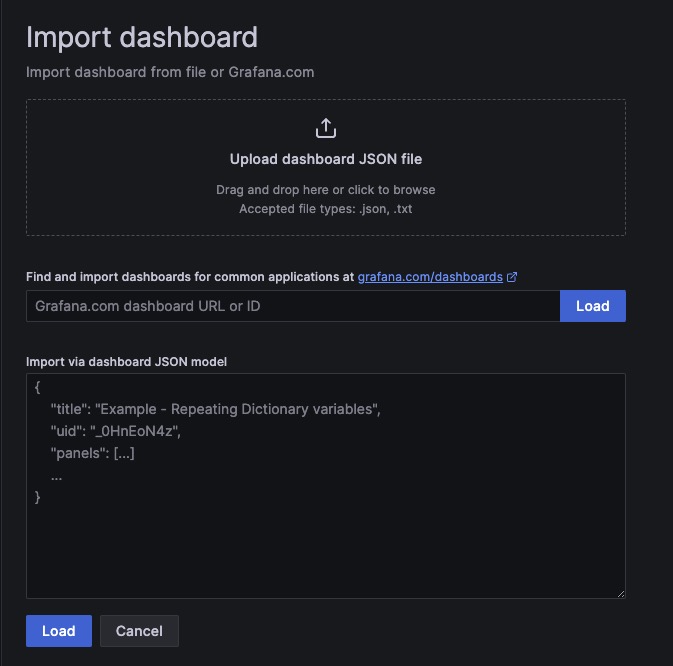
Importing Dashboard
Importing a dashboard in Grafana allows you to bring in pre-configured dashboards from other sources or users. This feature enables you to quickly add and use dashboards created by the Grafana community or share dashboards with your team. By importing a dashboard, you can save time and effort in creating visualizations and monitoring setups from scratch. You can click to browse file or drag and drop the file to import the dashboard.
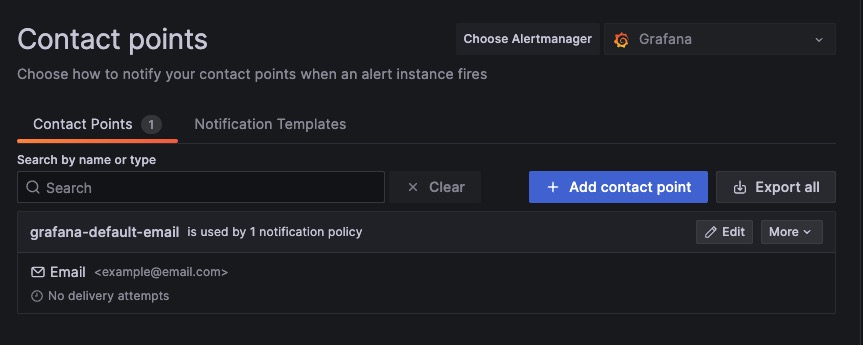
Creating Contact Points
Contact Points are the configuration setting used to specify the addresses of the nodes in a Cassandra cluster. These contact points are used by Grafana to establish connections and communicate with the Cassandra database. By providing the contact points, Grafana can connect to the Cassandra cluster and retrieve data for visualization and analysis. You can create new contact points by clicking on the "Add Contact Point" button.
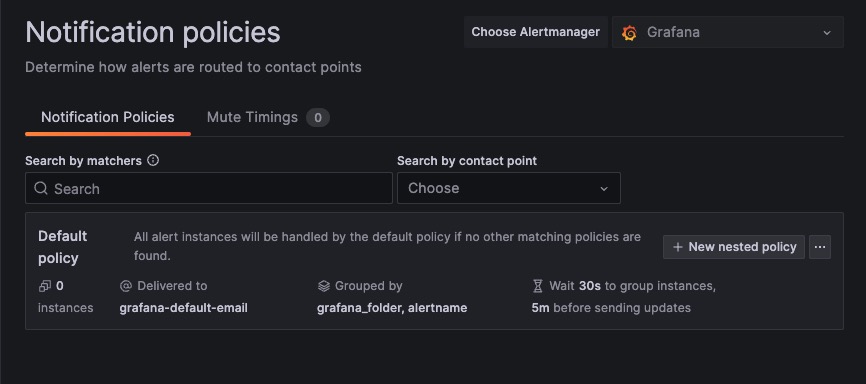
Notification Policies
Notification policies in Grafana are configurations that define how and when notifications should be sent based on certain conditions or events. These policies allow you to set up alerts and notifications for specific metrics, thresholds, or anomalies in your data. You can configure notification policies to send notifications via various channels such as email, Slack, PagerDuty, or other supported notification integrations. These policies can be customized to specify the recipients, message templates, and other settings for each notification. You can create different notification policies by clicking on the "Notification Policy" section.
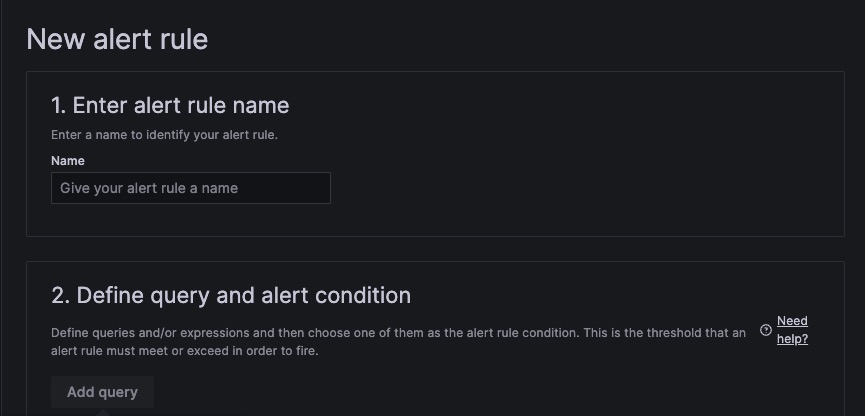
Creating New Alert Rule
Alert rules in Grafana are configurations that define conditions or thresholds for triggering alerts based on specific metrics or events. These rules allow you to set up notifications or take automated actions when certain conditions are met. Alert rules in Grafana are typically defined using the Grafana Alerting engine or by integrating with external alerting systems such as Prometheus Alert manager. They can be customized to specify the conditions, severity levels, notification channels, and other settings for each alert.