InfluxDB is an open-source time series database and serves as a solution for managing and accessing time series data across various domains including operations monitoring, application metrics, Internet of Things sensor data, and real-time analytics. Additionally, it offers compatibility with Graphite for data processing.
SignIn
On your first visit to the site, you will be presented with the login/signup screen.
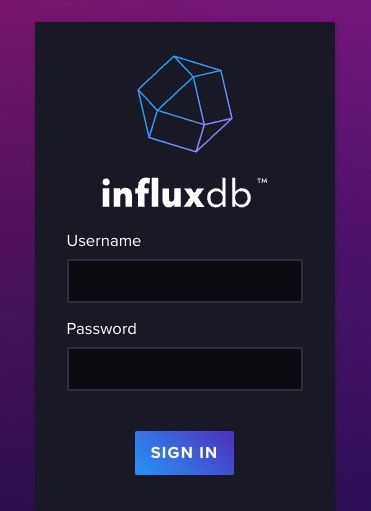
When your instance is first created, an account is created for you with the email you chose. You can get the password for this account by going to your Elestio dashboard and clicking on the "Show Password" button.
Enter your email, name and password and click the "Sign In" button
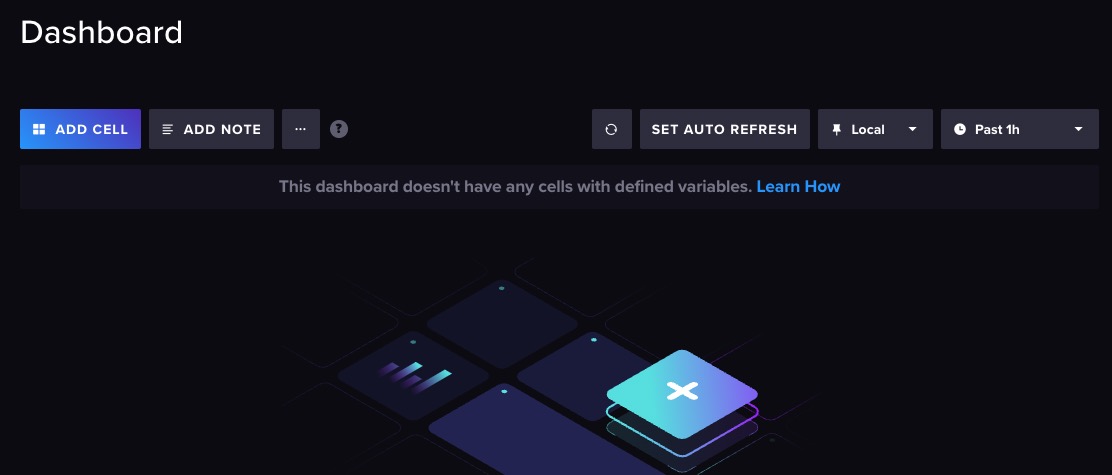
Dashboard
A dashboard in InfluxDB is a visual representation of data that allows users to monitor and analyze metrics, events, and other time-series data. It provides a centralized view of important information, such as graphs, charts, and tables, which can be customized to display specific data points and metrics. Dashboards in InfluxDB help users gain insights, track performance, and make data-driven decisions.
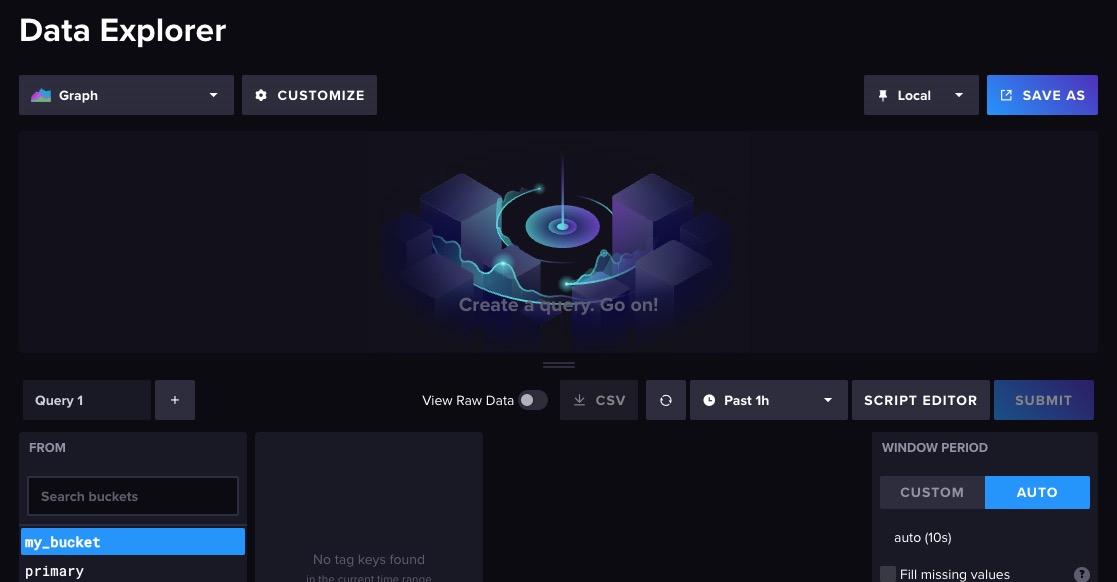
Explorer
Data Explorer allows you to query and visualize your time-series data. It provides an interface for exploring and analyzing data stored in InfluxDB. With the Data Explorer, you can write and execute queries to retrieve specific data points or metrics from your time-series database. It supports various query functions and operators that enable you to filter, aggregate, and transform your data. This allows you to perform complex data analysis and gain insights from your time-series data. You can access the Data Explorer by clicking on "Data Explorer" from the left navigation bar.
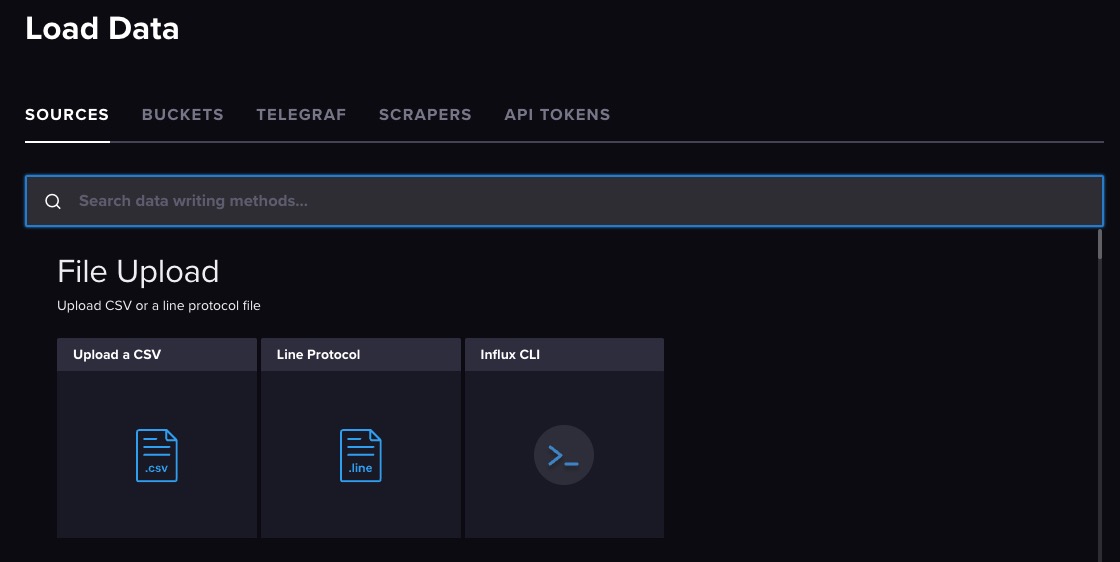
Load Data
Loading data in InfluxDB refers to the process of inserting or importing time-series data into an InfluxDB database. This data can come from various sources such as sensors, applications, or other data collection systems. InfluxDB provides several methods for loading data, including using the InfluxDB command-line interface (CLI), writing data directly to the InfluxDB HTTP API, or using client libraries in programming languages like Python or Go. Once the data is loaded into InfluxDB, it can be queried, analyzed, and visualized using tools like dashboards and data explorers. You can load data by clicking on "Load Data" from the left navigation bar.
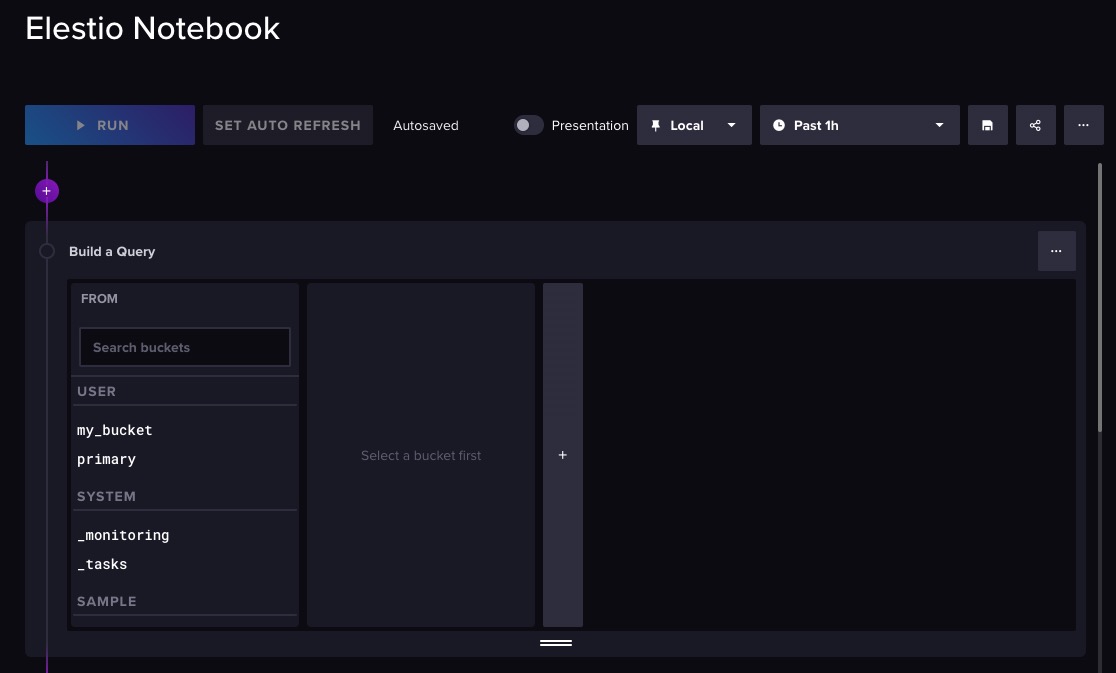
Notebook
Notebook is allows users to create and execute interactive data analysis workflows. It provides a web based interface where users can write and run queries, visualize data, and document their analysis process. Notebooks in InfluxDB are useful for exploring and manipulating time-series data, performing statistical analysis, creating visualizations, and sharing insights with others. You can create and manage notebooks by clicking on "Notebooks" from the left navigation bar.
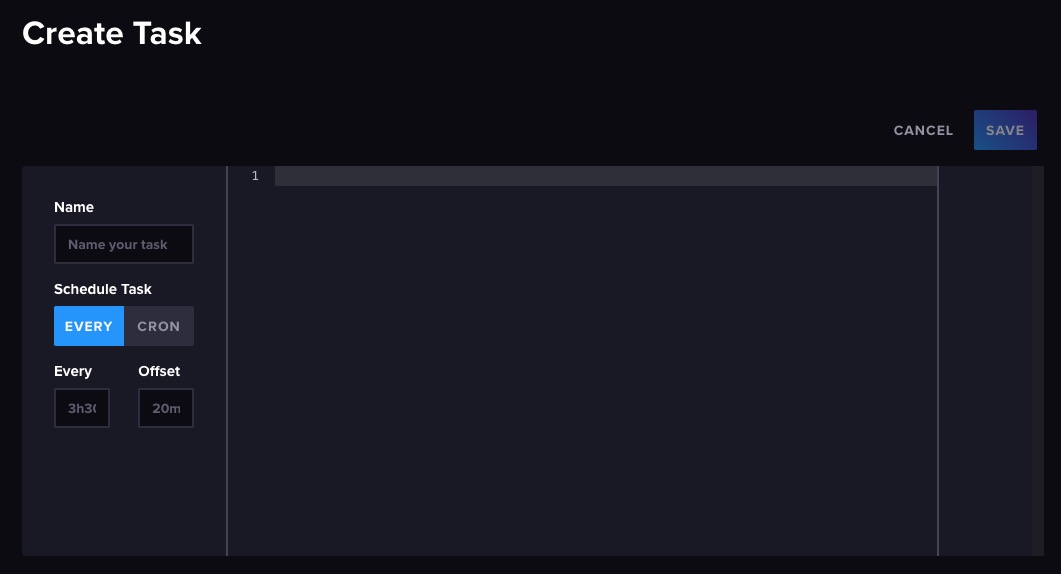
Task
Tasks are automated scripts or workflows that perform specific actions on time-series data. Tasks can be scheduled to run at regular intervals or triggered by specific events. They are used for various purposes such as data aggregation, data transformation, data cleaning, and alerting. Tasks in InfluxDB are written in the Flux language, which is a functional data scripting language specifically designed for querying and manipulating time-series data. You can create and manage tasks by clicking on "Tasks" from the left navigation bar.
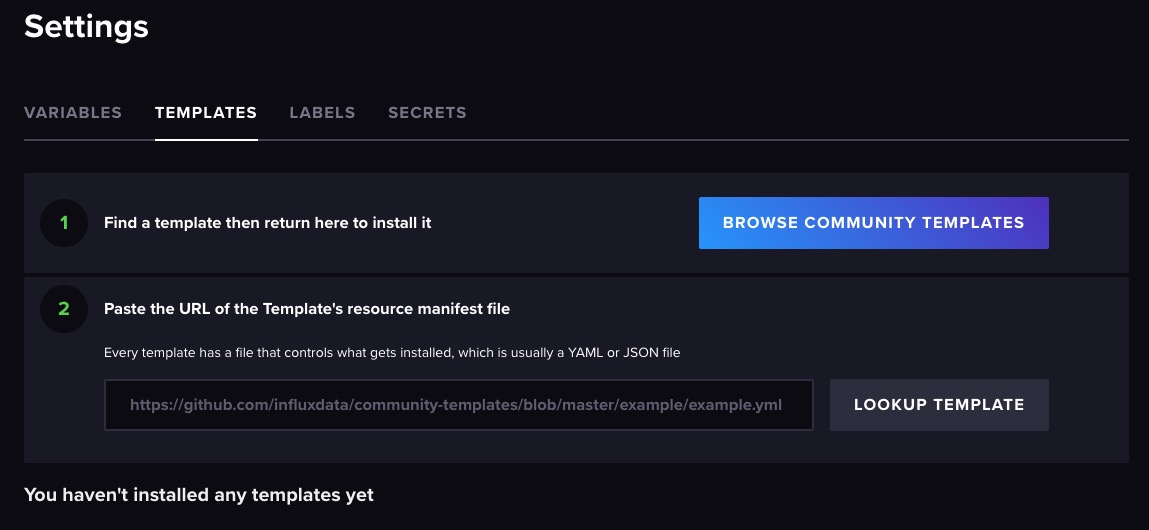
Templates
Templates are pre-configured dashboards, queries, and variables that can be easily shared and reused across different instances or projects. Templates provide a convenient way to package and distribute commonly used configurations, making it easier for users to get started with monitoring and visualizing their data. Templates can include predefined visualizations, alert rules, and data sources, allowing users to quickly set up monitoring and analysis for specific use cases or industries. You can access template section by clicking on "Settings > Templates" from the left navigation bar.