KNIME is an open source tool for analyzing data. It helps you organize, process, and understand large amounts of information easily. With KNIME, you can explore data visually without needing to write complex code. It offers an interface that allows users to explore, manipulate, and interpret data visually, eliminating the need for technical expertise.
Sign In
On your first visit to the site, you will be presented with the login/signup screen.
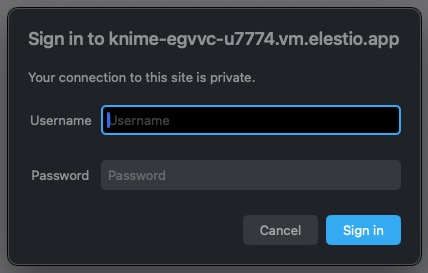
When your instance is first created, an account is created for you with the email you chose. You can get the password for this account by going to your Elestio dashboard and clicking on the "Show Password" button.
Enter your email, name and password and click the "Sign In" button
Description
Description are textual explanation or documentation associated with a node or workflow element. It provides users with additional information about the purpose, functionality, or usage of the node or workflow component. Descriptions in KNIME serve as helpful guides for users, helping them understand the context and usage of various elements within their data analysis workflows. You can access description by clicking on project.
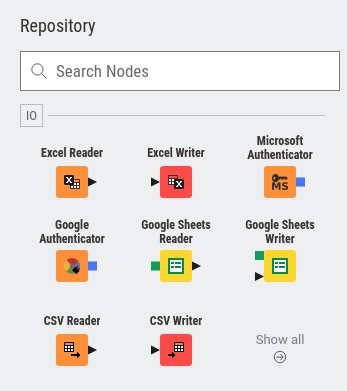
Node Repository
Node Repository is a collection or catalog of all available nodes that users can use to build and customize their data analysis workflows. These nodes represent different functionalities or operations that users can perform on their data, such as data manipulation, visualization, machine learning algorithms, and more. The Node Repository provides users with access to a vast array of pre built nodes that they can drag and drop into their workflows, making it easy to construct complex data analysis pipelines without the need for extensive coding.
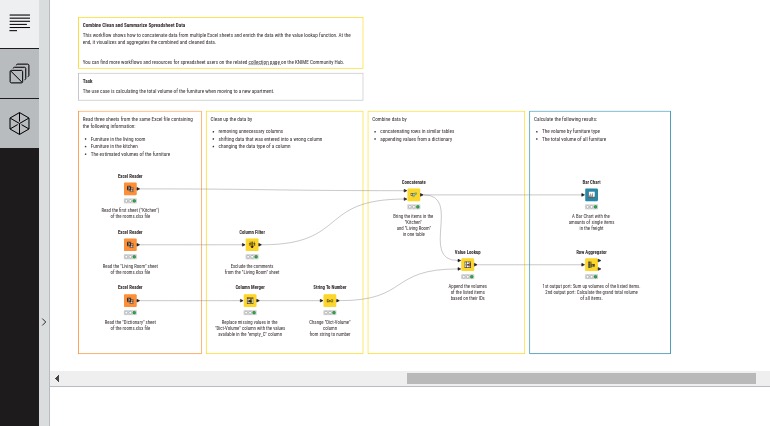
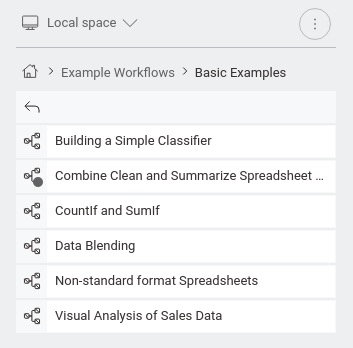
Space Explorer
Space Explorer is designed to facilitate the organization and navigation of workflows within the KNIME Analytics Platform. It provides users with a visual representation of the various components and connections within a workflow, helping them understand the structure and dependencies of their analysis pipelines. The Space Explorer allows users to zoom in and out, pan across the workflow canvas, and navigate through different parts of the workflow easily. It also provides features for collapsing and expanding nodes to focus on specific sections of the workflow, as well as search functionality to quickly locate nodes or components within the workflow. You can access the space explorer by heading over to the project section.
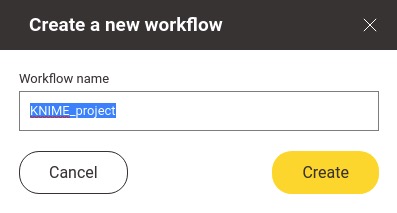
Creating New Workflow
Workflow is a visual representation of a data analysis process or pipeline. It consists of a series of interconnected nodes, each representing a specific data processing operation or task, such as data manipulation, transformation, analysis, or visualization. Workflows in KNIME allow users to visually construct and customize data analysis processes without the need for programming knowledge, making it accessible to a wide range of users, including data scientists, analysts, and domain experts. Users can drag and drop nodes onto the workflow canvas, connect them together to define the flow of data, and configure their properties to tailor the analysis to their specific needs.
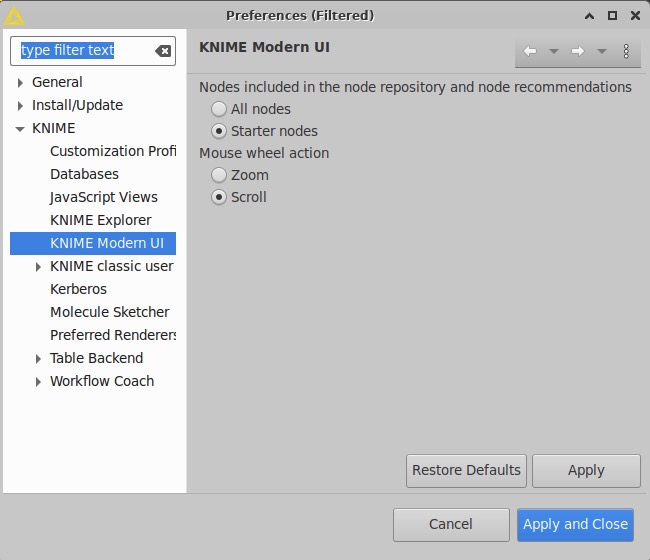
Preferences
Preferences is section where users can customize various settings and configurations to tailor their experience according to their preferences and requirements. The Preferences menu includes options related to user interface settings, data management, performance optimization, workflow behavior, node configurations, and more. Users can adjust settings such as font sizes, color schemes, default file locations, memory allocation, and node configurations to optimize their workflow environment and improve efficiency.