Loki is an open source, self hosted log aggregation system. It is built on top of the Prometheus platform for collecting, storing, and querying log data. Loki is helps your application to be highly available, scalable, and reliable, making it suitable for use in production environments.
Login
On your first visit to the site, you will be presented with the login/signup screen.
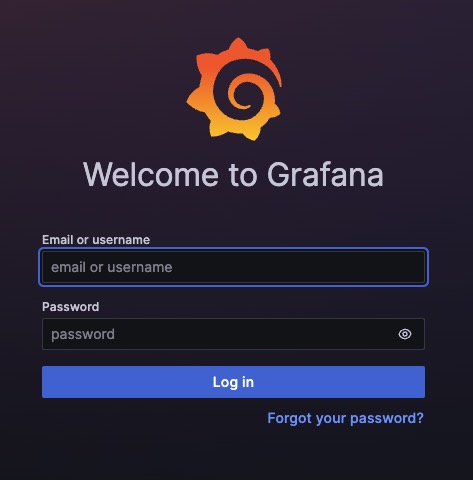
When your instance is first created, an account is created for you with the email you chose. You can get the password for this account by going to your Elestio dashboard and clicking on the "Show Password" button.
Enter your email, name and password and click the "Log in" button
Creating Panel
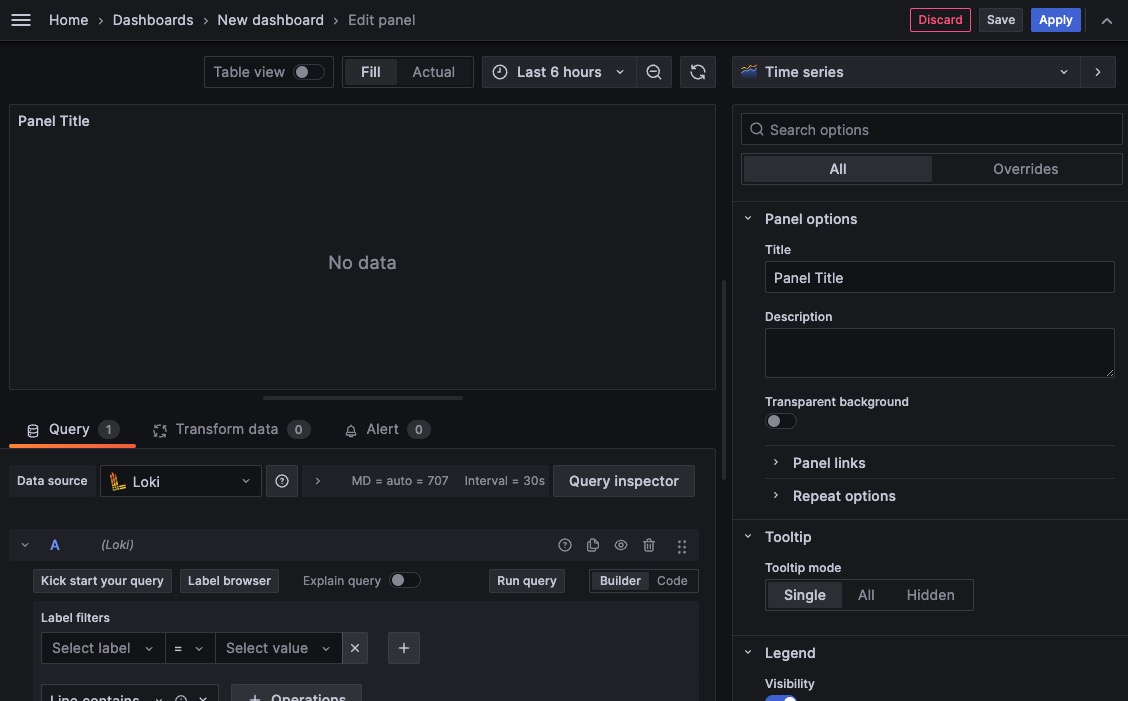
The panel in Loki is the main user interface where you can view and interact with your logs and log data. It provides a graphical representation of your log data, allowing you to easily navigate, search, and analyze your logs. Within the panel, you can perform various actions such as filtering logs based on specific criteria, applying queries to search for specific log entries, and visualizing log data using different charts and graphs. The panel is a central component of Loki and serves as the primary interface for managing and analyzing your log data.
Selecting Data Source
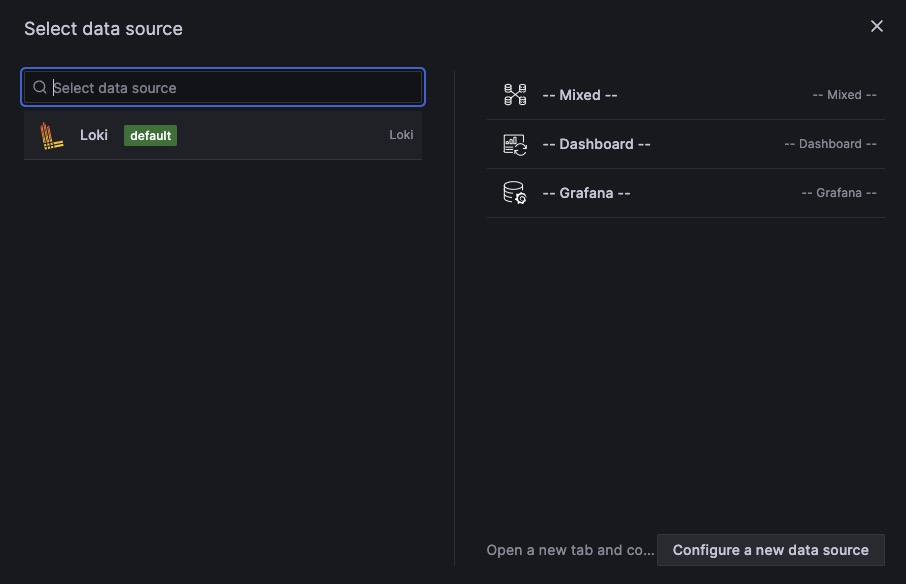
A datasource in Loki is the source of log data that Loki collects and indexes. It can be a file, a stream, or any other log source that generates log events. Loki uses datasources to ingest log data and make it available for searching, filtering, and analysis within the Loki panel. Datasources can be configured and managed within the Loki configuration settings, allowing you to specify the log sources you want Loki to collect data from. You can select as many datasources as you want to be able to view and analyze your log data.
Plugins
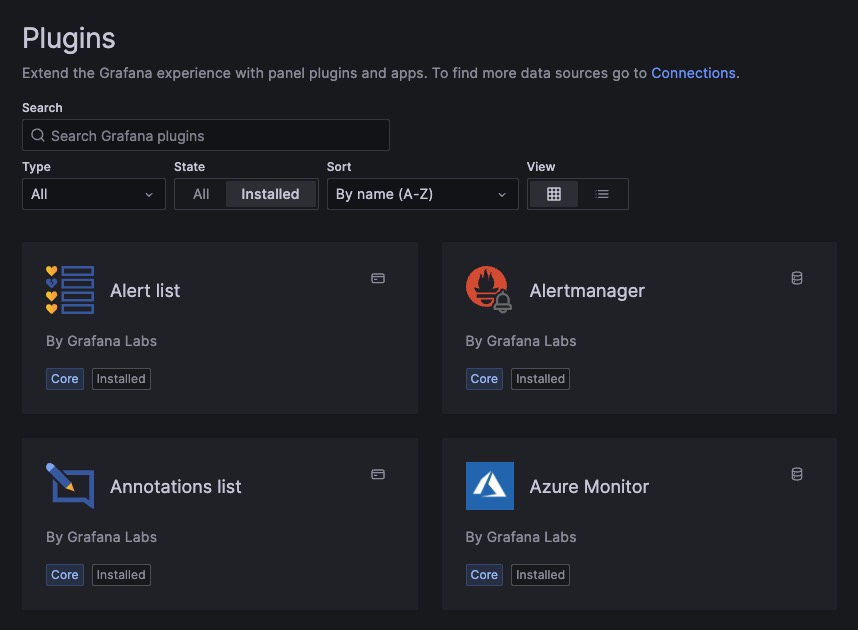
Plugins in Loki are the extensibility mechanism provided by the Loki logging library. Plugins allow you to customize and enhance the functionality of Loki by adding additional features or modifying existing ones. You can use plugins to integrate with external systems, implement custom log processing logic, or extend the available output options. By using plugins, Users can tailor Loki to meet your specific logging requirements and integrate it seamlessly into your application. You can configure and manage plugins within the Loki configuration settings, allowing you to enable or disable specific plugins and customize their behavior.
New Alert Rule
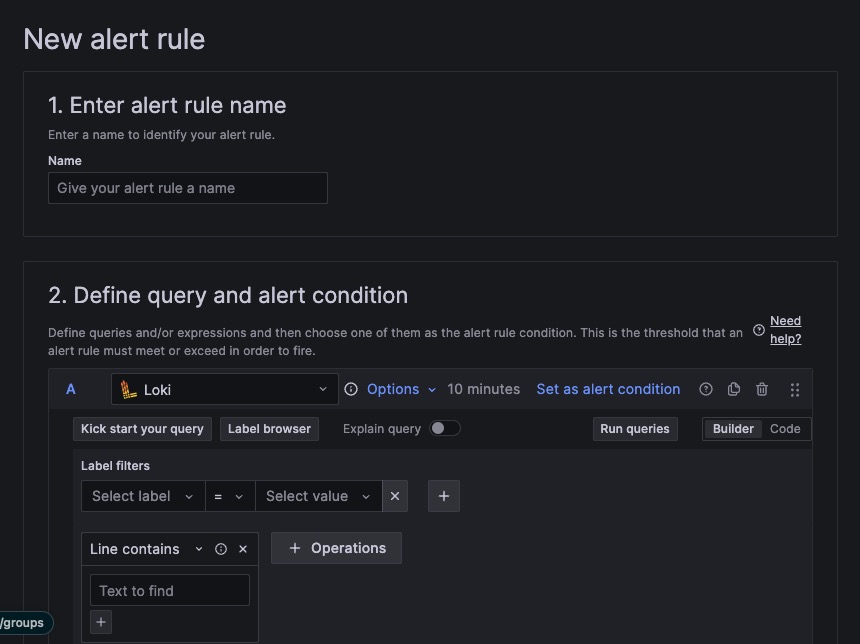
The Alert Manager in Loki is a component that handles alerting based on log data. It allows you to define rules and conditions for generating alerts based on specific log events or patterns. When an alert condition is met, the Alert Manager can send notifications or trigger actions to notify users or perform automated tasks. Alerts can be configured and managed within the Loki configuration settings, allowing you to set up and customize alerting behavior according to your requirements. You can define alert rules, specify alert thresholds, and configure alert actions to be taken when an alert is triggered.
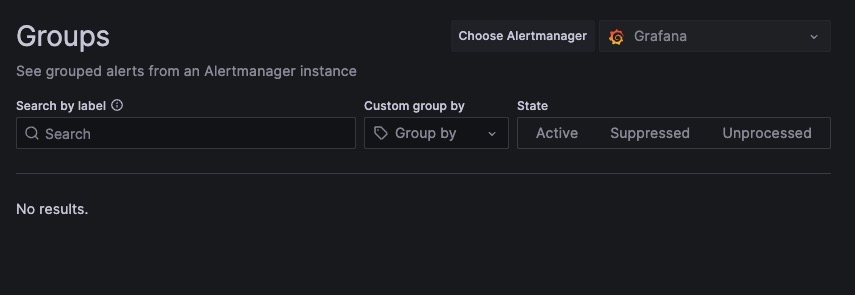
Groups
Groups in Loki are a way to organize and manage your log data. They allow you to group related logs together based on certain criteria, such as application name, environment, or any other custom attribute. By organizing logs into groups, you can easily filter and search for specific logs within a particular group, making it convenient to analyze and troubleshoot issues related to a specific component or application. Groups can be created and managed within the Loki panel, allowing you to define and customize your log data organization according to your needs.
