PostHog is an open source product analytics platform that allows you to track, analyze, and visualize user behavior. With features such as funnels, graphs & trends, user paths, correlation analysis, retention, stickiness, lifecycle, dashboards, and HogQL, PostHog helps you to make data driven decisions and optimize your product.
Login
On your first visit to the site, you will be presented with the login/signup screen.
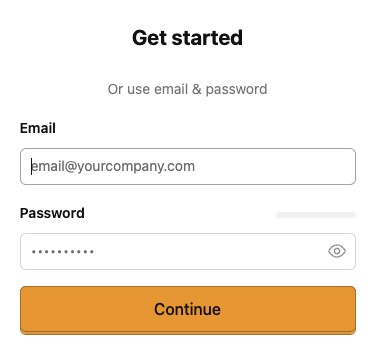
When your instance is first created, an account is created for you with the email you chose. You can get the password for this account by going to your Elestio dashboard and clicking on the "Show Password" button.
Enter your username and password and click the "Login" button.
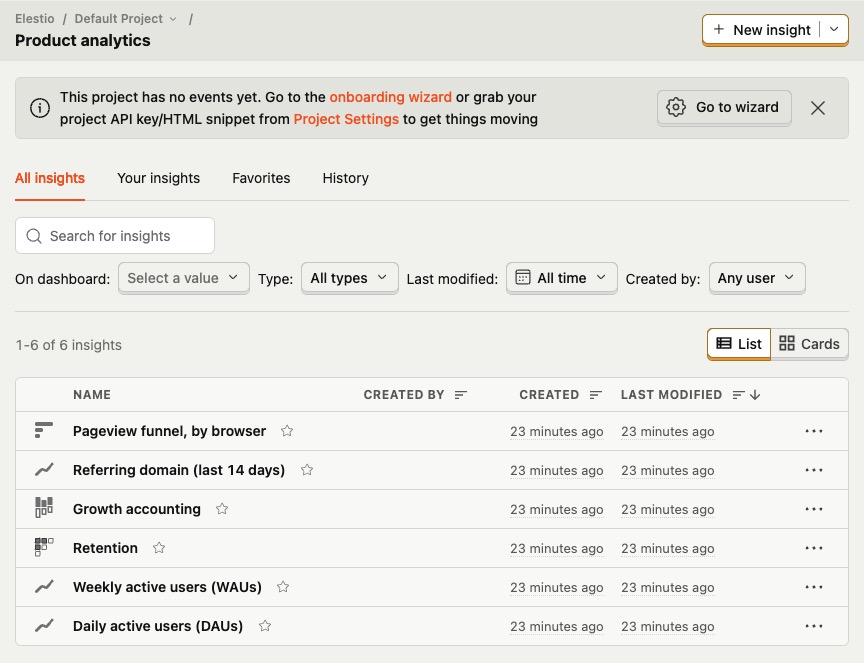
Product Analytics
Analytics is a suite of tools for collecting, analyzing, and visualizing user interaction data with your application or website. It includes event tracking, user analytics, funnel analysis, retention analysis, and dashboards. These tools provide insights into user behavior, inform product development decisions, identify potential issues or opportunities, and measure the impact of changes or initiatives. Product Analytics is a way to understand how users interact with your product and to make data driven decisions. PostHog is flexible analytics platform that can be used to track and analyze user behavior, and to gain insights into how users interact with your product.
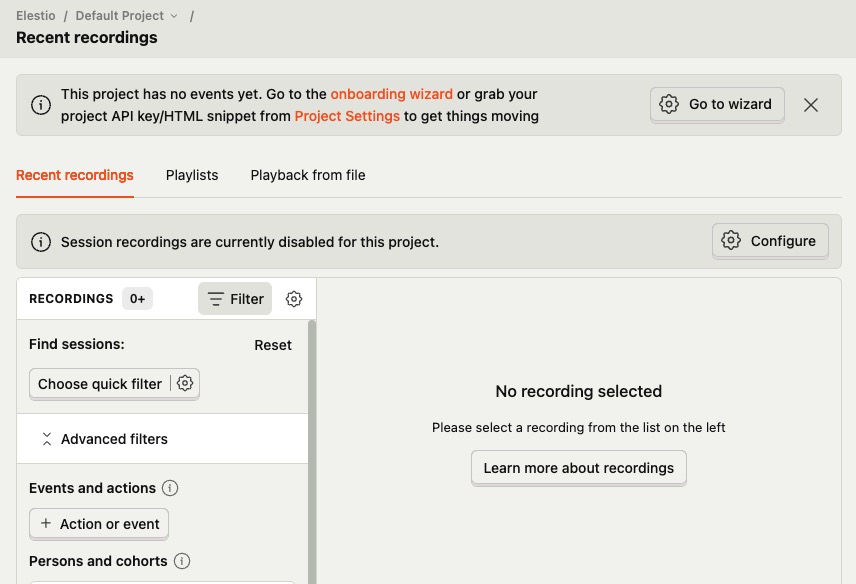
Session Recording
Session recording in PostHog allows you to capture and replay user sessions on your application or website. It records the user's interactions, such as mouse movements, clicks, and keystrokes, providing valuable insights into how users navigate and interact with your product. Session recording helps you understand user behavior, identify usability issues, and optimize the user experience. It can be used to track user journeys, identify drop off points, and gain insights into how users interact with your product.
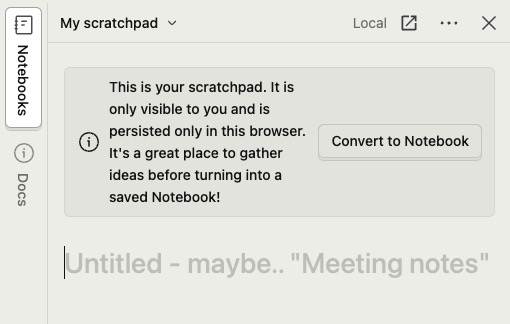
Notebook
Notebook allows you to create and execute code snippets directly within the PostHog interface. It provides a convenient way to analyze data, perform calculations, and generate insights using Python code. You can write and run Python code in real time, visualize the results, and save your analysis for future reference. The notebook feature is particularly useful for data exploration, ad-hoc analysis, and creating custom reports. It can be used to perform complex analysis, generate custom visualizations, and gain insights into user behavior. The notebook is a tool for data scientists, analysts, and developers to explore and analyze data directly within PostHog.
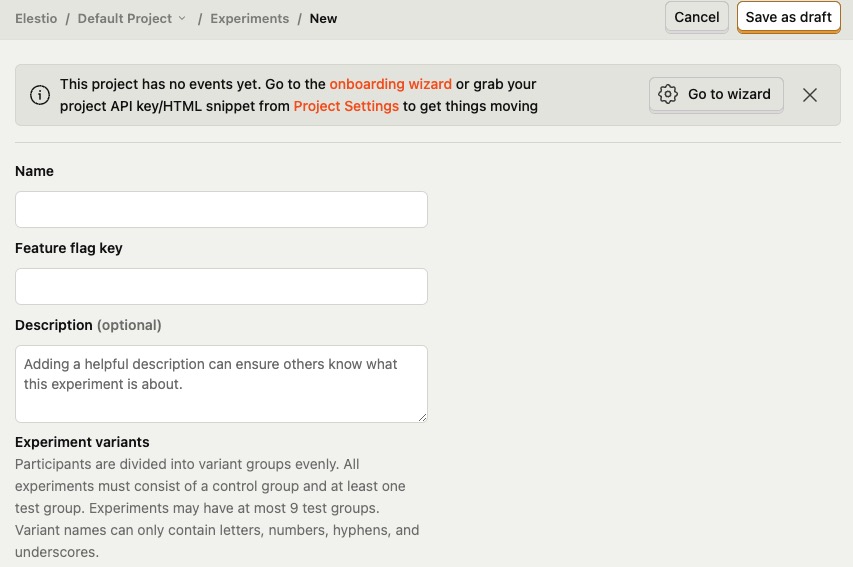
Creating Experiments
Experiments in PostHog allows you to run A/B tests and feature flag experiments to test different variations of your product or website. It helps you measure the impact of changes on user behavior and make data driven decisions. With experiments, you can create different variations of a feature, define goals and metrics to track, and analyze the results to determine the most effective version. It's used for optimizing user experience and driving product improvements. Experiments can be used to test new features, design changes, and user interface modifications.
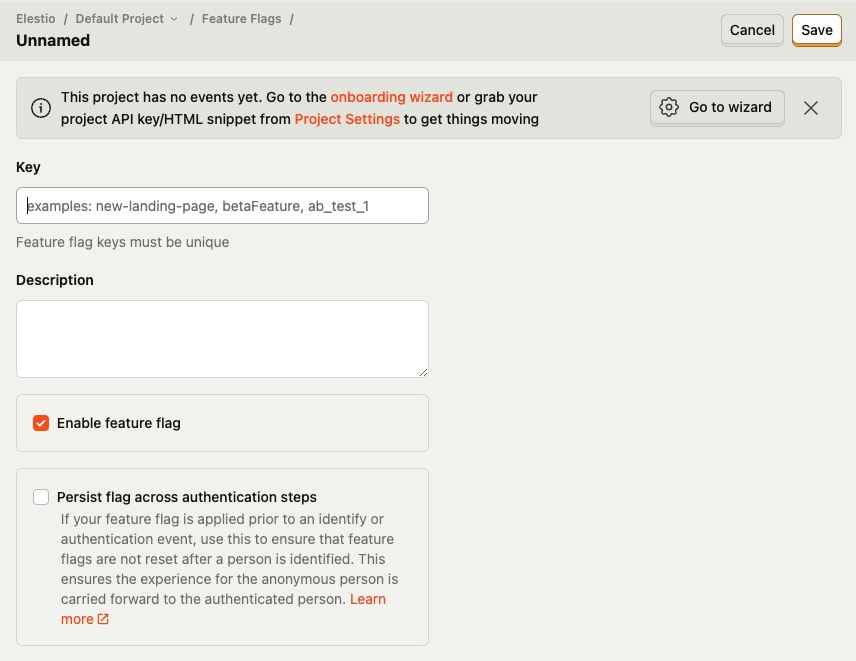
Feature Flags
Feature flags in PostHog are a way to control the availability of certain features or functionality in your product or website. They allow you to toggle features on or off for different segments of users, without the need for deploying new code. Feature flags can be used for gradual rollouts, A/B testing, canary releases, and more. They provide flexibility and enable you to make data driven decisions about feature releases and optimizations. Flags can be used to control the availability of new features, experiment with different variations, and manage feature releases. Feature flags are a way to manage and control the availability of features in your product.
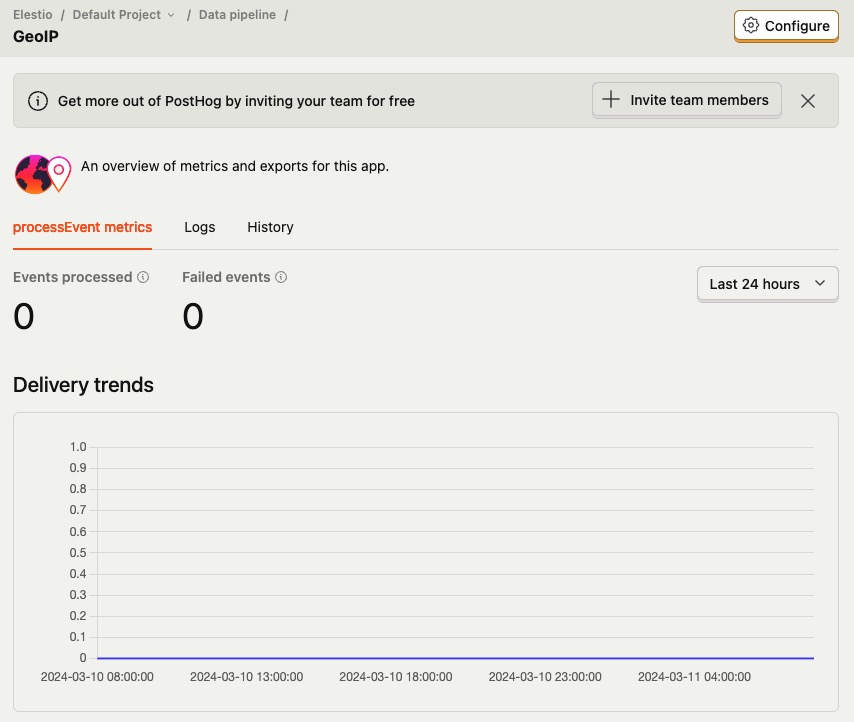
Data Pipeline
Data Pipeline refers to the process of collecting, transforming, and analyzing data from various sources to gain insights and make informed decisions. It involves capturing events or actions performed by users, such as clicks or page views, and sending them to PostHog for further processing. The data pipeline in PostHog allows you to track and analyze user behavior, create funnels, and generate reports to understand how users interact with your product. It provides a structured way to organize and analyze data, enabling you to make data driven decisions and improve the user experience.