Sensu is an open source distributed NoSQL database that is designed for high performance and low latency. It is based on the Apache Cassandra database and is compatible with the Cassandra Query Language (CQL).
Sign in
On your first visit to the site, you will be presented with the login/signup screen.
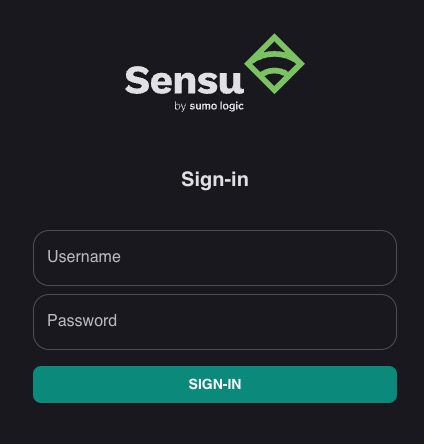
When your instance is first created, an account is created for you with the email you chose. You can get the password for this account by going to your Elestio dashboard and clicking on the "Show Password" button.
Enter your username and password and click the "Sign in" button.
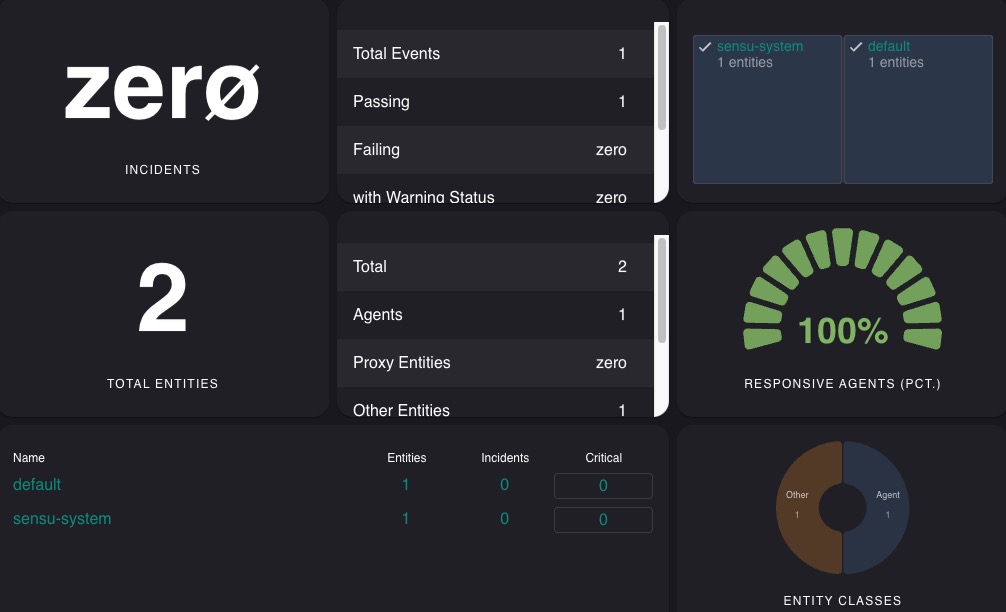
Dashboard
The dashboard in Sensu is a graphical user interface that provides an overview of the monitoring data and status of your infrastructure. It allows you to view and analyze metrics, events, namespaces, services, silencing, entities, and catalogs. The dashboard provides a high-level view of the health and performance of your infrastructure, making it easier to identify issues and take action. It is used for monitoring and managing your infrastructure effectively. The dashboard screen in Sensu is designed to provide a view of the monitoring data and status of your infrastructure. It can be used to monitor the health and performance of your infrastructure, identify issues, and take action to resolve them.
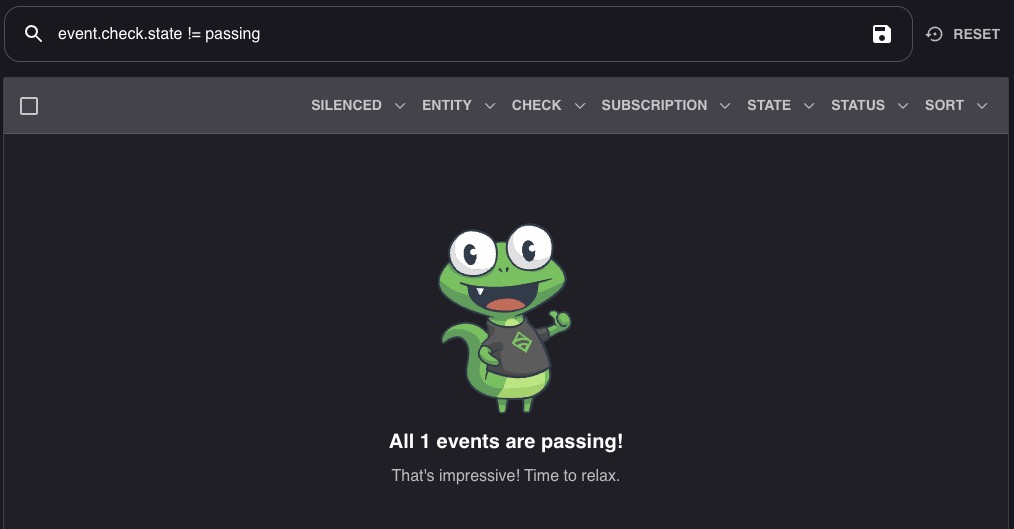
Events
Events in Sensu represent occurrences or incidents that are detected and monitored within your infrastructure. They can include various types of events such as service failures, resource utilization spikes, or any other abnormal behavior that needs attention. The Events screen in Sensu provides a detailed view of these events, allowing you to analyze and take appropriate actions to resolve them. It is used for monitoring and managing events within your infrastructure. The events screen in Sensu is designed to provide a comprehensive view of the events detected and monitored within your infrastructure. It can be used to identify, analyze, and resolve issues that require attention.
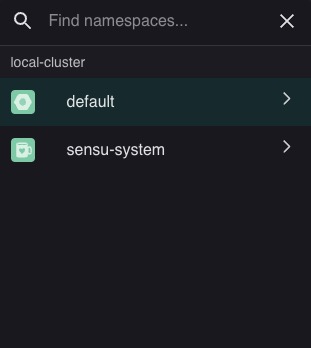
Namespaces
Namespaces in Sensu provide a way to organize and isolate resources within the Sensu monitoring system. They allow you to logically group and manage entities, checks, handlers, and other Sensu objects. Namespaces help in separating monitoring configurations and data for different environments, teams, or applications. They provide a level of isolation and control, allowing you to define access control policies and limit visibility of resources to specific users or teams. Namespaces can be used to create a multi-tenant monitoring environment or to organize resources based on different criteria.
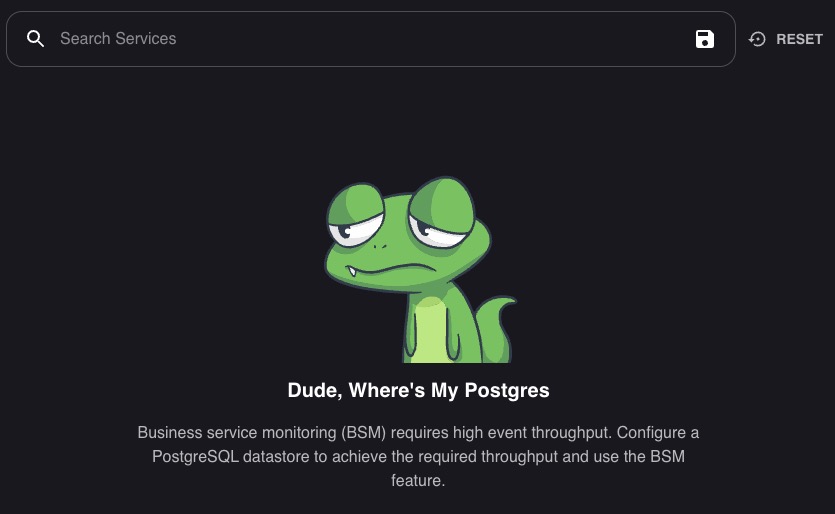
Services
Services in Sensu represent the components or applications that are being monitored within your infrastructure. They can include web servers, databases, microservices, or any other software or hardware components that you want to monitor for health and performance. The Services screen in Sensu provides a detailed view of these monitored services, allowing you to analyze their status, metrics, and events. Sensu services screen is designed to provide a view of the monitored services within your infrastructure. It can be used to monitor the health and performance of your services, identify issues, and take action to resolve them.
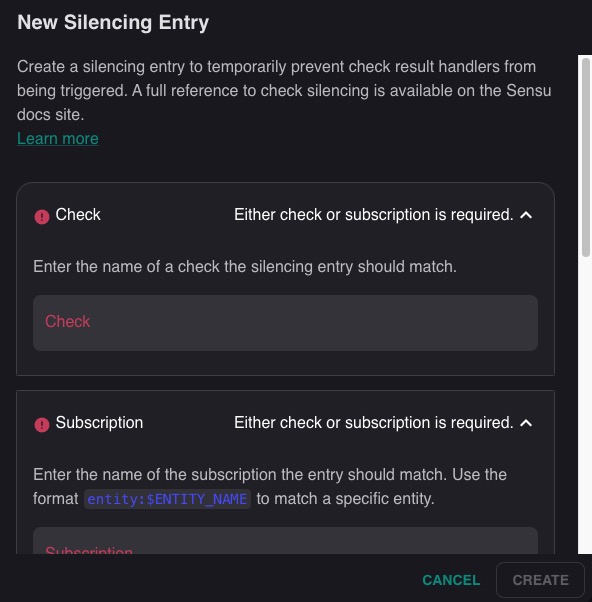
New Silencing Entry
New Silencing Entry in Sensu refers to the feature that allows you to silence specific checks or entities within your infrastructure. It is used to temporarily suppress alerts or notifications for a defined period of time. This can be useful when you are performing maintenance tasks or troubleshooting issues and do not want to be alerted for known issues. To create a new silencing entry, you would provide the details of the check or entity you want to silence, along with the duration of the silence period.
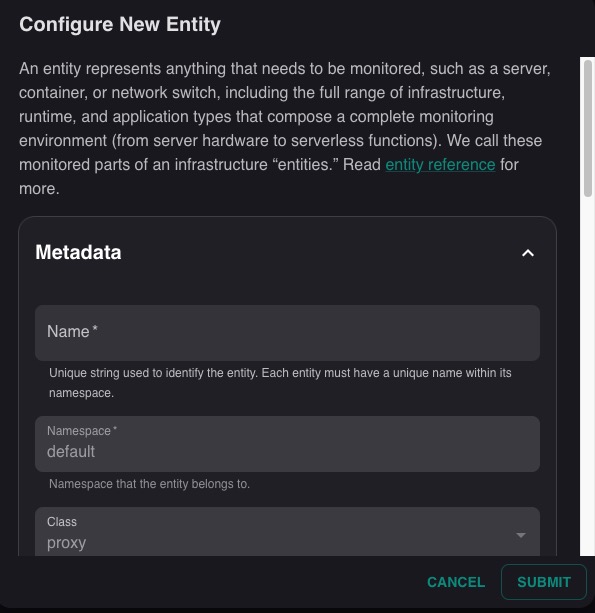
Configuring New Entity
Configuring New Entity is the process of adding a new entity to the Sensu monitoring system. An entity in Sensu represents a monitored component in your infrastructure, such as a server, container, network device, or any other resource that you want to monitor. To configure a new entity, you would provide details such as the entity's name, type, class, and any relevant metadata. You can also specify the checks that should be run for the entity, and configure other settings related to the entity's monitoring and alerting behavior. Once the entity is configured, Sensu will start monitoring it and collecting data based on the specified checks. This data can then be viewed and analyzed in the Sensu dashboard, allowing you to track the health and performance of the entity over time.
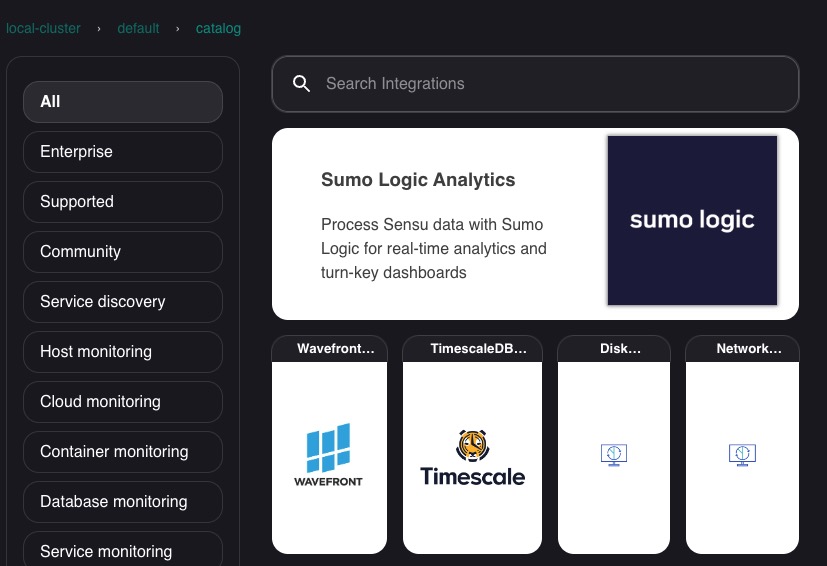
Catalog
Catalog provides a centralized view of all the checks that are configured across your monitored entities. It allows you to see the status and details of each check, including its name, command, interval, and other configuration details. The Catalog screen in Sensu provides a visual representation of this information, making it easier to manage and monitor your checks. It's a useful tool for understanding the health and performance of your infrastructure at a glance.