SigNoz is an open source observability platform that helps you monitor and troubleshoot your applications. It provides metrics, traces, and usage analytics to help you understand the performance and behavior of your applications. SigNoz helps you identify bottlenecks, troubleshoot issues, and optimize the performance of your applications.
Login
On your first visit to the site, you will be presented with the login/signup screen.
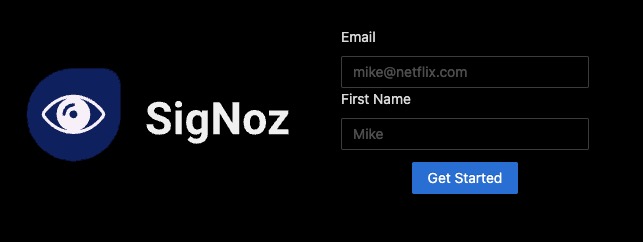
When your instance is first created, an account is created for you with the email you chose. You can get the password for this account by going to your Elestio dashboard and clicking on the "Show Password" button.
Enter your username and password and click the "Login" button.
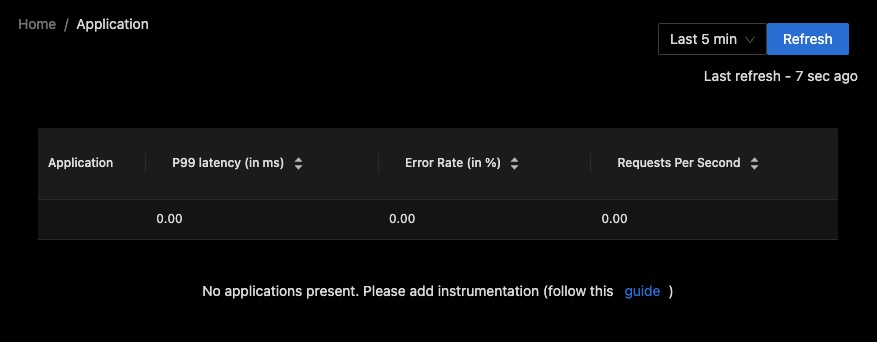
Metrics
Metrics in Signoz is the quantitative measurements of various aspects of your application's performance and behavior. It includes data such as response times, error rates, throughput, and resource utilization. These metrics provide insights into the health and performance of your application, allowing you to identify bottlenecks, troubleshoot issues, and optimize your system. The metrics screen in Signoz provides visual representations of these metrics through charts, graphs, and tables, making it easier to monitor and analyze the data effectively. It is used to track key performance indicators, identify trends, and make data driven decisions to improve your application's performance.
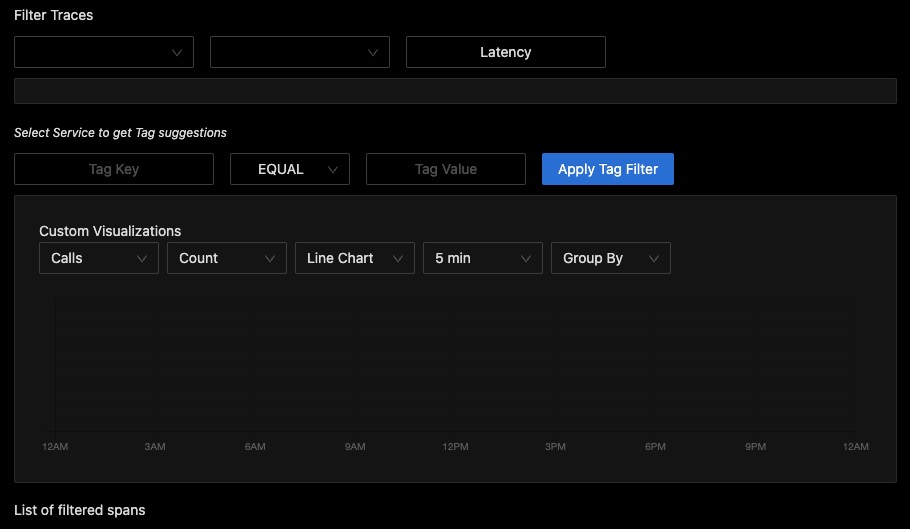
Traces
Traces in Signoz is end-to-end flow of a request as it traverses through different components of your application. They capture the timing and dependencies of each operation within the request, allowing you to visualize and analyze the performance and behavior of your application. Traces provide insights into the latency, errors, and bottlenecks in your system, helping you identify and troubleshoot issues. The traces screen in Signoz displays the trace data in a structured format, making it easier to understand the flow of requests and analyze the performance of your application. It is used to track the execution path of requests, identify performance bottlenecks, and optimize the performance of your application.
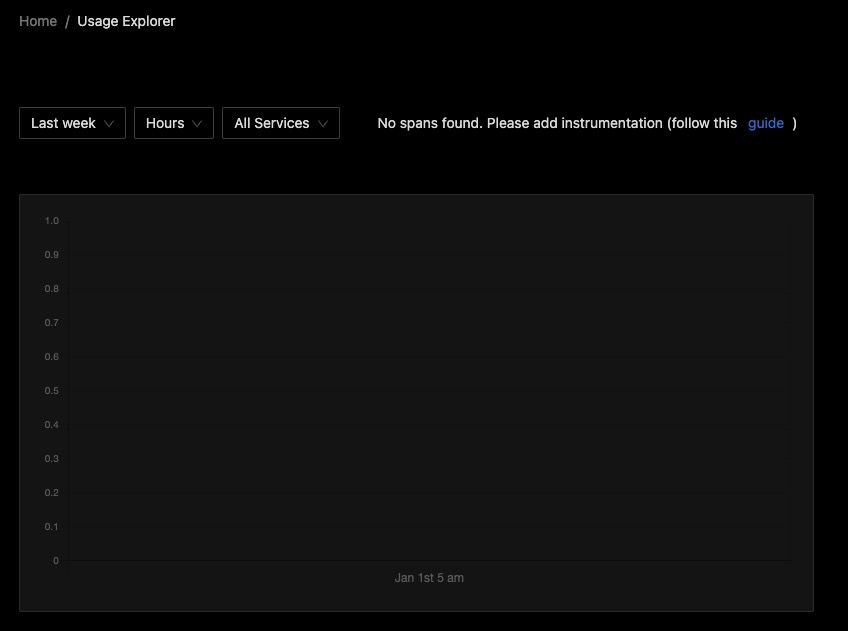
Usage Explorer
The Usage Explorer in Signoz allows you to explore and analyze the usage patterns of your application. It provides insights into how your application is being used by capturing and visualizing data such as user interactions, API calls, and resource utilization. The Usage Explorer screen in Signoz displays this data in a format, making it easier to understand and analyze the usage patterns of your application. It is used to track user behavior, identify popular features, and optimize the user experience of your application. The Usage Explorer screen is used to analyze the usage patterns of your application, identify trends, and make data driven decisions to improve the user experience.
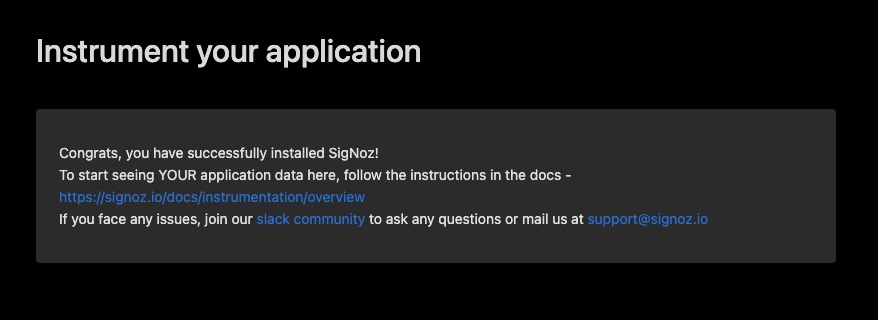
Instrument Your Application
Instrumenting in Signoz refers to the process of adding code to your application to collect and send data to Signoz for monitoring and analysis. This data includes metrics, traces, and usage patterns. By instrumenting your application, you can gain insights into its performance, behavior, and user experience. This allows you to identify bottlenecks, troubleshoot issues, and optimize your system. The instrument screen in Signoz provides a way to configure and manage the instrumentation of your application. It allows you to define the data to be collected, set up monitoring rules, and customize the instrumentation process. The instrument screen is used to instrument your application effectively, enabling you to monitor and analyze its performance.