Apache Superset is an open source data exploration and visualization tool. With 40+ pre-installed visualizations, it provides a comprehensive set of options to visualize your data. The drag and drop interface and support for SQL queries make it easy to create interactive dashboards. Superset offers data caching for faster load times, Jinja templating for customization, and CSS templates to match your brand's look and feel.
Sign In
On your first visit to the site, you will be presented with the login/signup screen.
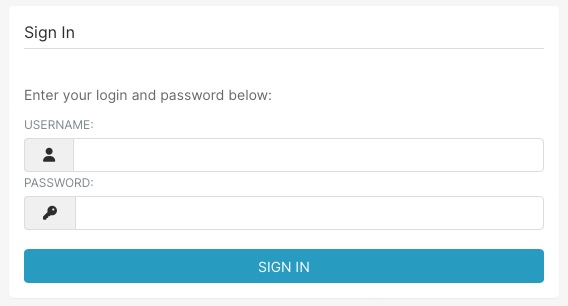
When your instance is first created, an account is created for you with the email you chose. You can get the password for this account by going to your Elestio dashboard and clicking on the "Show Password" button.
Enter your email, name and password and click the "Sign In" button
Dashboards
Dashboards in Superset provide a way to visualize and analyze data. With Superset, you can effortlessly create and customize interactive dashboards, utilizing a wide range of charts and graphs. Additionally, you can easily share your dashboards with others, import existing dashboards, and create new ones.
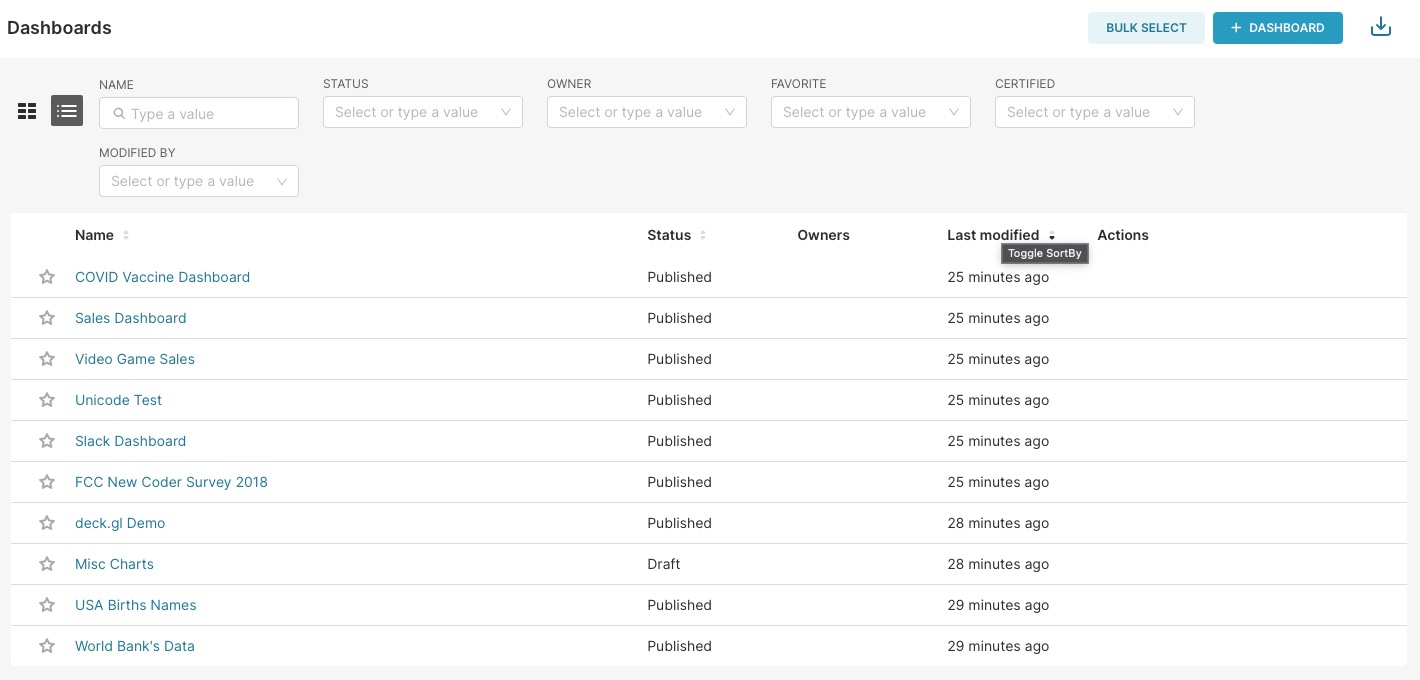
When accessing a dashboard in Superset, users are presented with a customizable interface. They have the ability to add and configure widgets according to their preferences, utilizing a variety of graphs and charts to effectively visualize their data. The customization options include adjusting the display settings and applying filters to enhance data exploration. Customizing dashboards in Superset allows users to tailor the visual representation of their data to meet specific requirements and objectives.
Charts
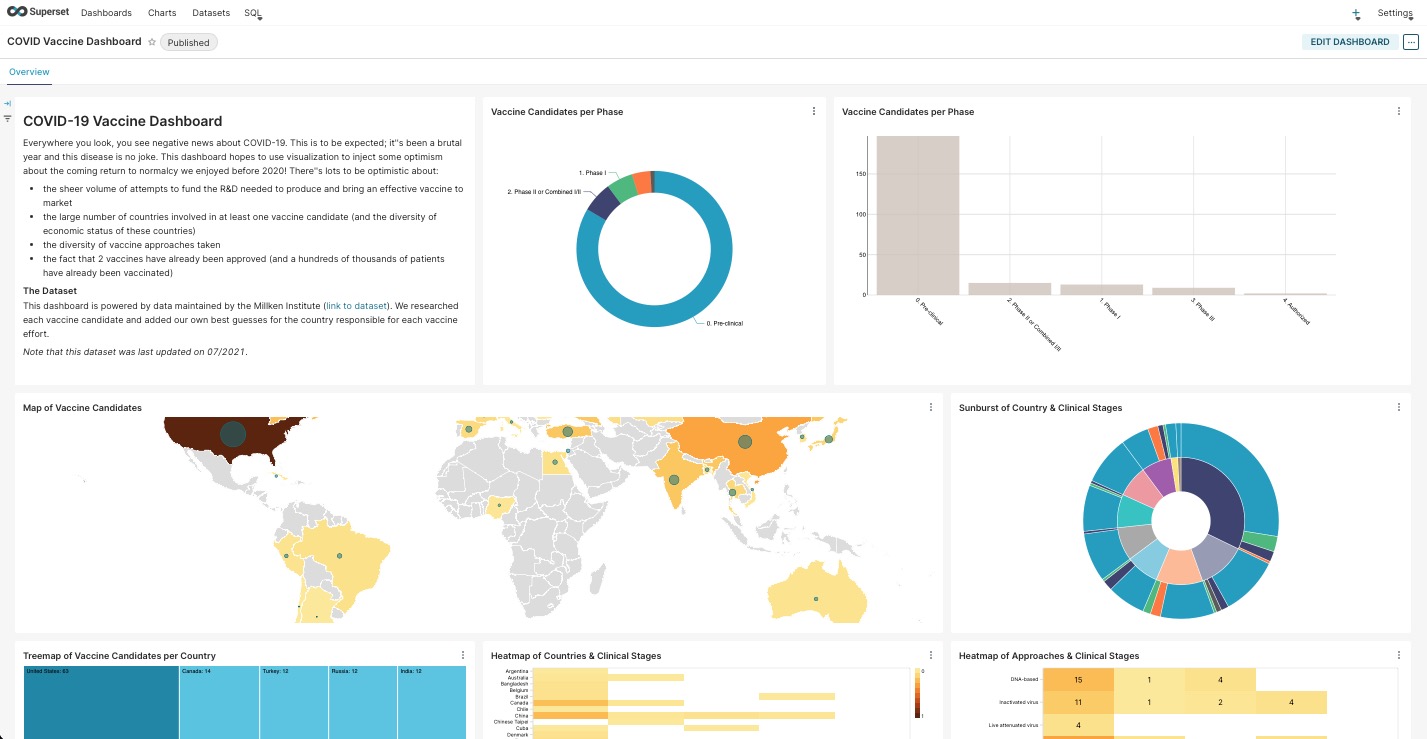
Charts serve as the fundamental components of interactive dashboards in Apache Superset. Charts enable users to effectively analyze and visualize their data. With the ability to add filters, apply mathematical functions, and choose from various chart types, Superset helps users to create visually appealing and insightful representations of their data.
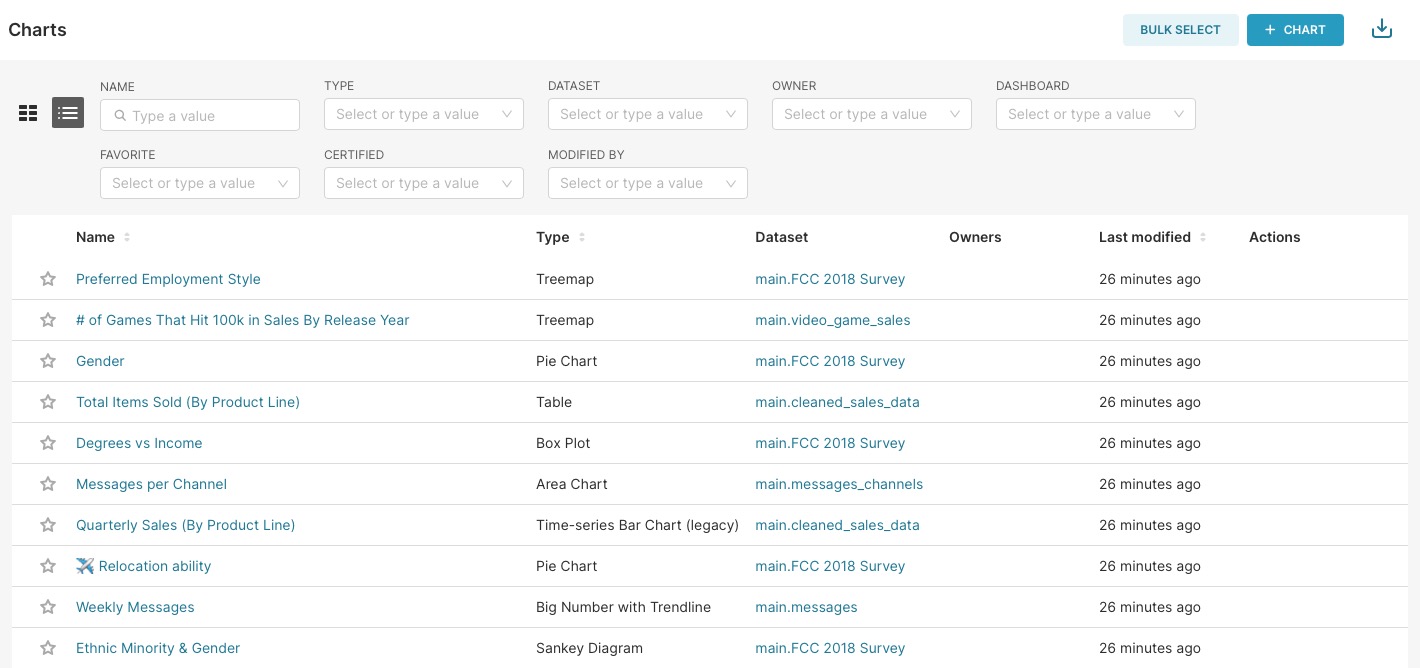
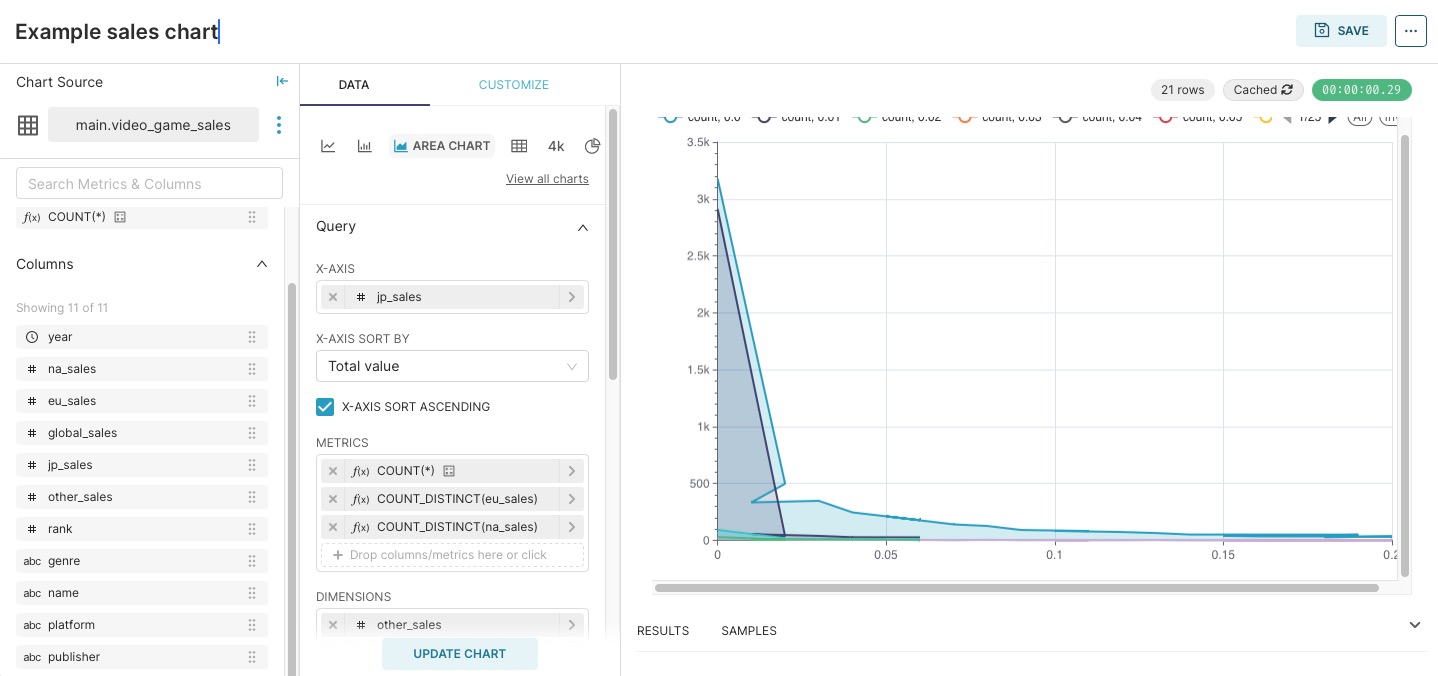
Charts help users to enhance the visual representation of their data by adding filters, customizing the chart's display settings, and applying mathematical differentiators. Users have the flexibility to choose from a variety of chart types, such as bar charts, line charts, and scatter plots, to effectively visualize their data.
Datasets
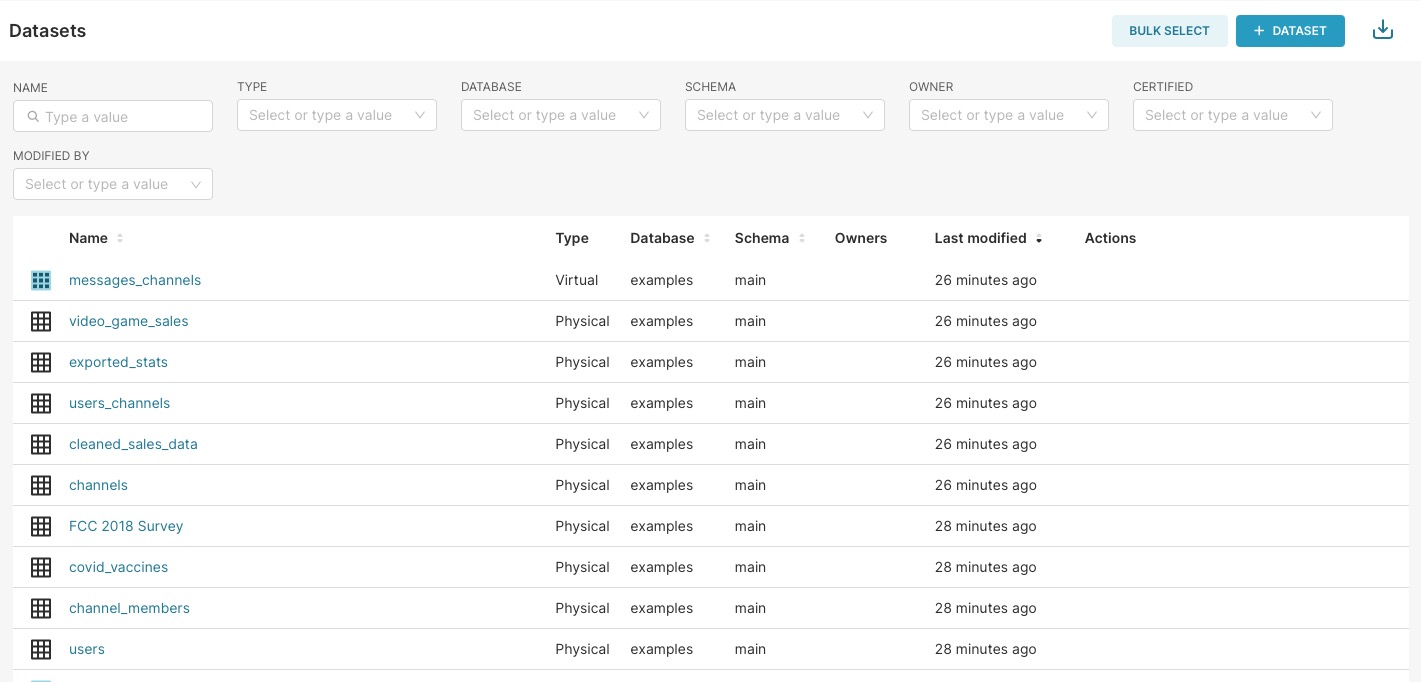
Datasets serve as the primary data sources for charts and dashboards in Apache Superset. They provide a foundation of raw data that can be utilized to create visually appealing visualizations. With Superset, you can create datasets, import them from external sources, and share them with others.
SQL Lab
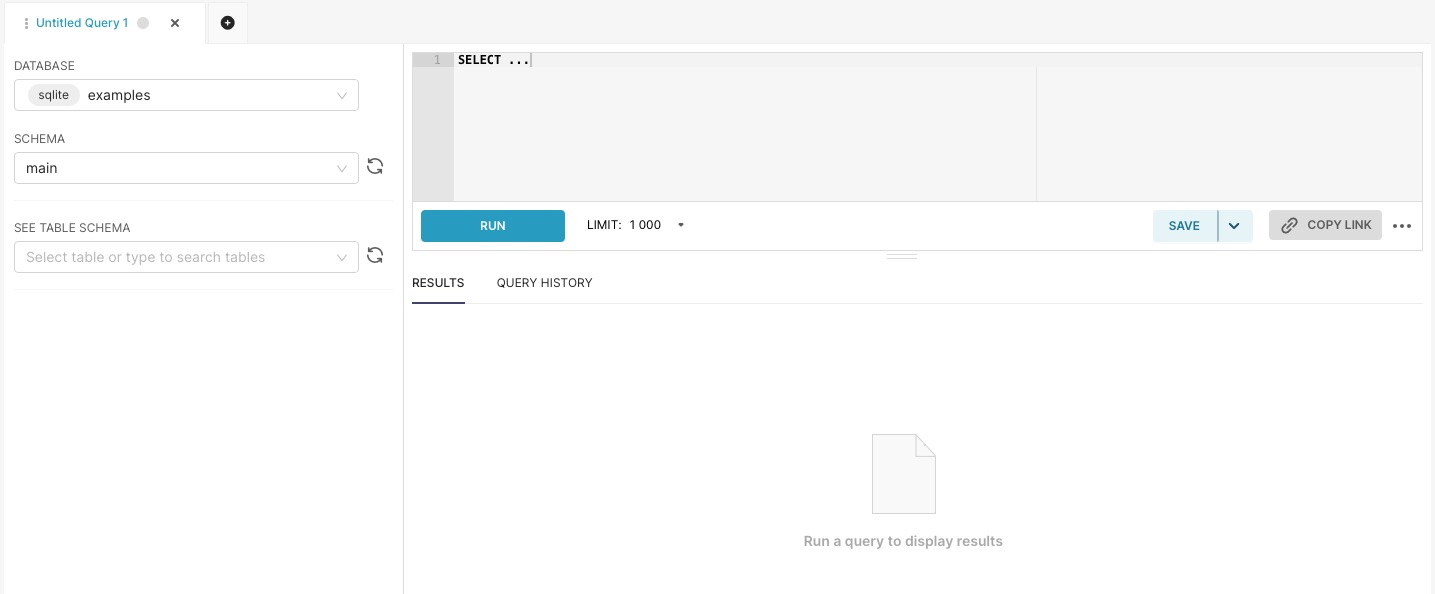
SQL Lab in Apache Superset allows you to connect to and query databases, providing a tool for data exploration and analysis. With SQL Lab, you can execute SQL queries on selected databases, save and rerun queries from the query history, and even run multiple queries simultaneously. It enables you to efficiently interact with databases, extract data, and perform complex data manipulations using SQL. Running multiple queries at once enhances productivity, and the option to save queries as files ensures easy access and sharing of query results.
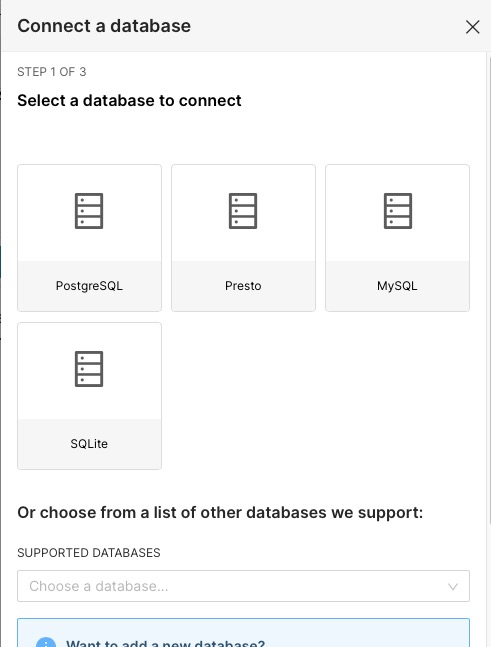
Connect a Database
Whether your database is hosted locally or on a remote server, Superset provides integration and easy data extraction capabilities. By connecting your database, you can have access to a wide range of charts, graphs, and visualizations to effectively analyze and visualize your data, the ability to create interactive dashboards that can be customized and shared with others.
Additional Access Control
Superset provides the ability to select and configure users and roles, allowing for access control within your instance. By defining permissions for each user and role, you can ensure that only authorized individuals have access to specific features and data. This enhances security and protects sensitive information. Additionally, the additional access control feature in Superset offers benefits such as improved governance, compliance with data privacy regulations, and the ability to track and audit user activities.

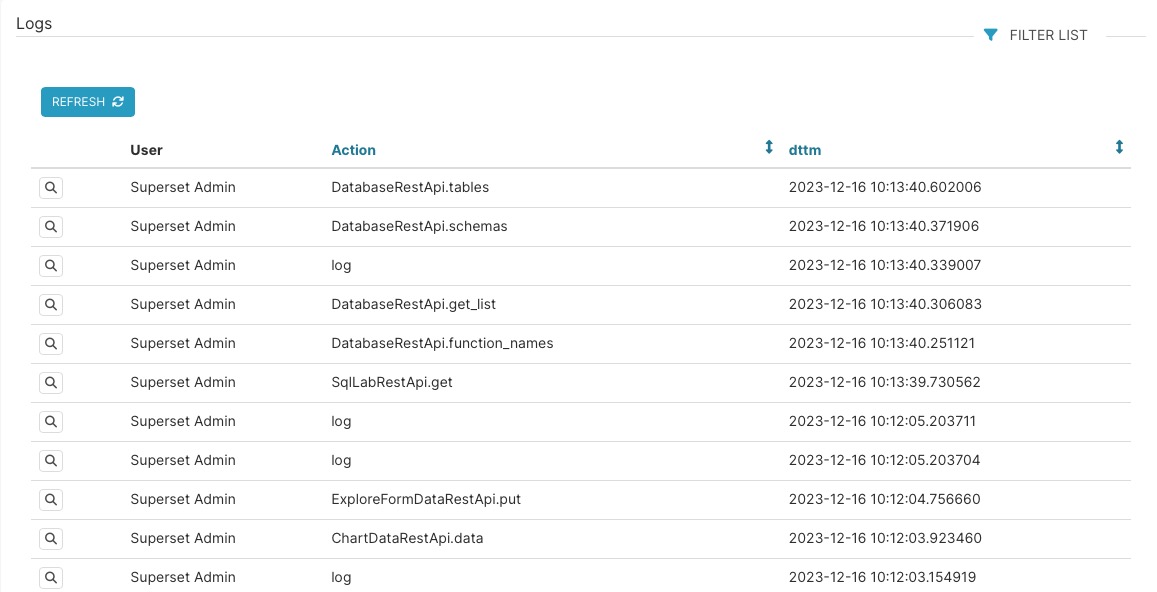
Logs
Logs in Apache Superset are records of all activities that have occurred on your instance. They provide a good overview of user interactions, queries executed, and system events. By accessing the logs through the Settings > Action Logs section, you can gain insights into the usage patterns, troubleshoot issues, and monitor the performance of your Superset deployment. You can filter and sort logs based on various criteria, such as time, user, or action type, you can easily analyze specific events or track the history of specific actions.
