Umami is an open source tool that provides website analytics. It allows you to track and analyze user behavior on your website, providing insights into your users' interactions, engagement, and preferences. Umami helps you understand how users navigate through your site, which pages are most popular, and how users interact with your content.
Login
On your first visit to the site, you will be presented with the login/signup screen.
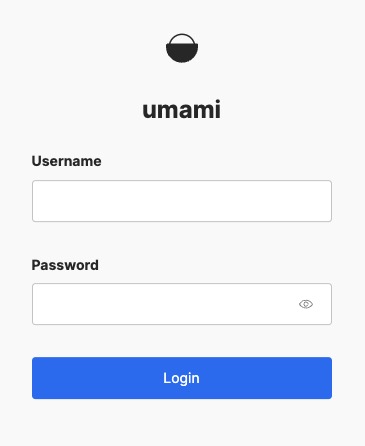
When your instance is first created, an account is created for you with the email you chose. You can get the password for this account by going to your Elestio dashboard and clicking on the "Show Password" button.
Enter your username and password and click the "Login" button.
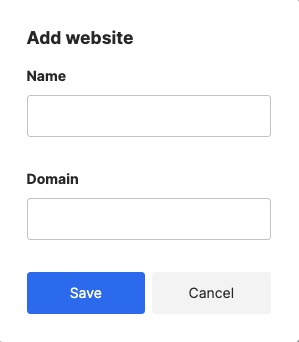
Adding Website
Website is a specific site that you are tracking with Umami analytics. Each website has its own unique tracking code that you can install on your site to start collecting data. The Website screen in Umami provides an overview of the tracked data for a specific website, including metrics like page views, unique visitors, bounce rate, and more. It allows you to monitor the performance of your website and gain insights into your users' behavior. The Website screen also provides options for customizing the appearance, layout, and behavior of your website analytics, allowing you to create a unique and interactive tracking experience for your site. The Website screen helps you track and analyze the traffic and engagement on your website, helping you make informed decisions and optimize your site for better performance.
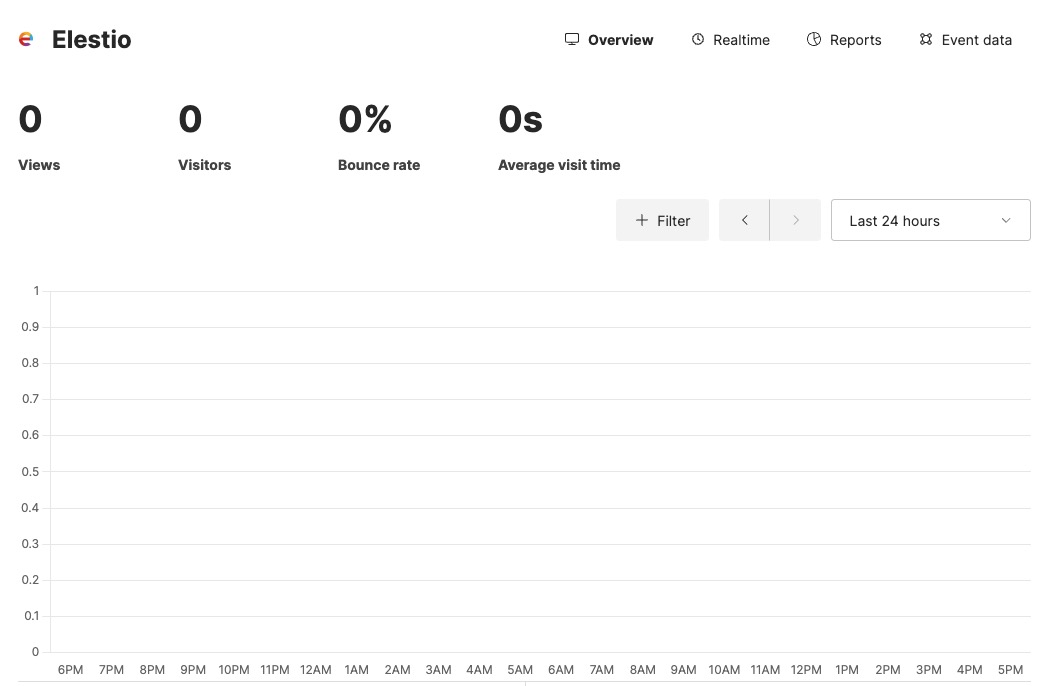
Overview
Overview is a summary view of your website's analytics data. It provides a high-level snapshot of key metrics such as page views, unique visitors, bounce rate, and more over a specified time period. The Overview screen in Umami presents this data in a clear and concise manner, making it easy to quickly understand your website's performance at a glance. It's starting point for analyzing your website's traffic and user behavior. The Overview screen also provides options for customizing the appearance, layout, and behavior of your analytics data, allowing you to create a personalized and efficient tracking experience. The Overview screen helps you track and monitor the overall performance of your website, enabling you to make data-driven decisions and optimize your site for better results.
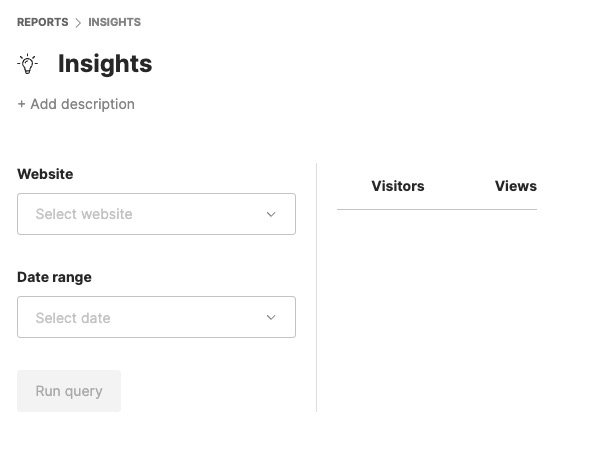
Insights
Insights provides a deeper analysis of your website's analytics data. It goes beyond the basic metrics and provides more detailed information about your users' behavior and interactions on your website. This could include insights into how users navigate through your site, which pages or features are most popular, where users are dropping off, and more. The Insights screen in Umami presents this data in a clear and understandable format, helping you to gain a deeper understanding of your users and improve your website accordingly. The Insights screen also provides options for customizing the appearance, layout, and behavior of your analytics insights, allowing you to create a personalized and insightful tracking experience. The Insights screen helps you identify trends, patterns, and opportunities for optimization on your website.
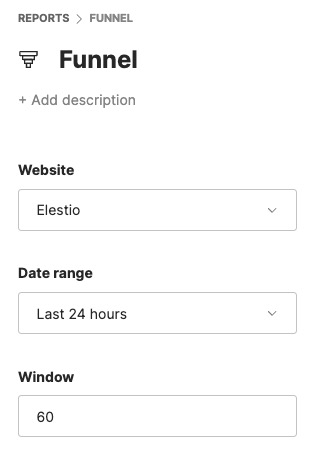
Funnel
Funnel in Umami provides a visual representation of the user journey on your website. It allows you to track and analyze the steps that users take to complete a specific goal or conversion on your site. This could include steps such as signing up, making a purchase, or completing a form. The Funnel screen helps you identify any bottlenecks or drop-off points in the user journey, allowing you to optimize your website and improve the conversion rate. It provides insights into the effectiveness of your marketing campaigns and user experience, helping you make decisions to drive better results. The Funnel screen also provides options for customizing the appearance, layout, and behavior of your analytics funnels, allowing you to create a personalized and effective tracking experience.
Event
Event is a specific action or interaction that a user performs on your website. This could include actions such as clicking a button, submitting a form, or viewing a page. The Event screen in Umami allows you to track and analyze these user events. It provides detailed information about each event, including the number of occurrences, the users involved, and the context in which the event occurred. This helps you understand how users are interacting with your website and which features or content are most engaging. The Event screen also provides options for customizing the appearance, layout, and behavior of your analytics events, allowing you to create a personalized and insightful tracking experience. The Event screen helps you track and monitor user interactions on your website, enabling you to optimize your site for better engagement and conversions.
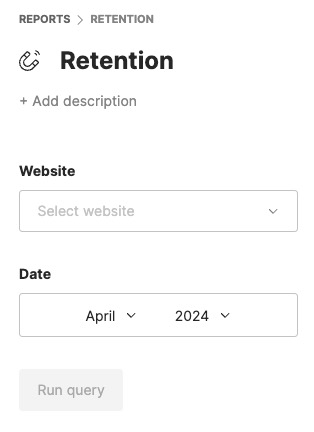
Retention
Retention is the measurement of user engagement over time. It tracks how many users return to your website after their initial visit and how often they come back. The Retention screen in Umami provides a visual representation of this data, showing the percentage of users that returned to your site after a certain number of days, weeks, or months. This can help you understand how engaging your website is and identify areas where improvements can be made to increase user retention. The Retention screen also provides options for customizing the appearance, layout, and behavior of your retention analytics, allowing you to create a personalized and effective tracking experience. The Retention screen helps you track and analyze user loyalty and engagement on your website, enabling you to optimize your site for better user retention and long-term success.