Zabbix is an open source monitoring tool that provides a platform for monitoring and managing your infrastructure. It allows you to monitor the performance and availability of servers, network devices, and applications in real-time. Zabbix helps you identify and resolve issues quickly, ensuring that your systems are running smoothly and efficiently.
Sign In
On your first visit to the site, you will be presented with the login/signup screen.
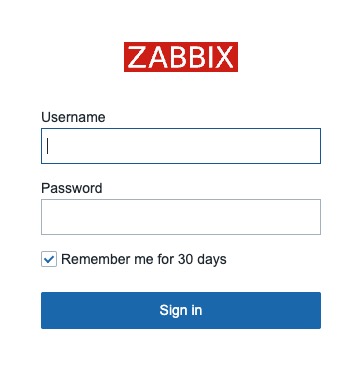
When your instance is first created, an account is created for you with the email you chose. You can get the password for this account by going to your Elestio dashboard and clicking on the "Show Password" button.
Enter your username and password and click the "Sign in" button.
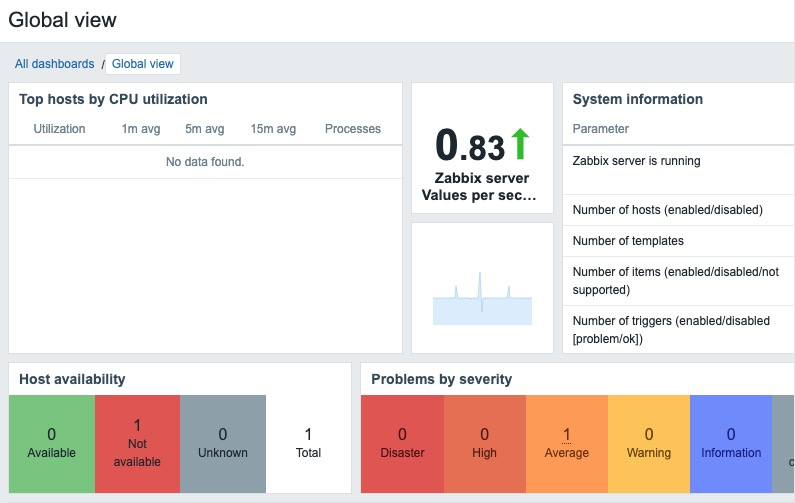
Global View
Global View is a dashboard that provides an overview of the entire monitoring environment. It displays a summary of the overall system status, including the number of monitored hosts, the number of problems, and other key metrics. This view helps administrators quickly understand the health of their infrastructure at a glance. The exact contents and layout of the Global View can be customized according to your needs. It provides a summary of the monitoring data, allowing you to quickly identify any issues that require attention. The Global View is a starting point for monitoring and managing your infrastructure. It provides an overview of the system status, enabling you to make informed decisions and take action to resolve any problems.
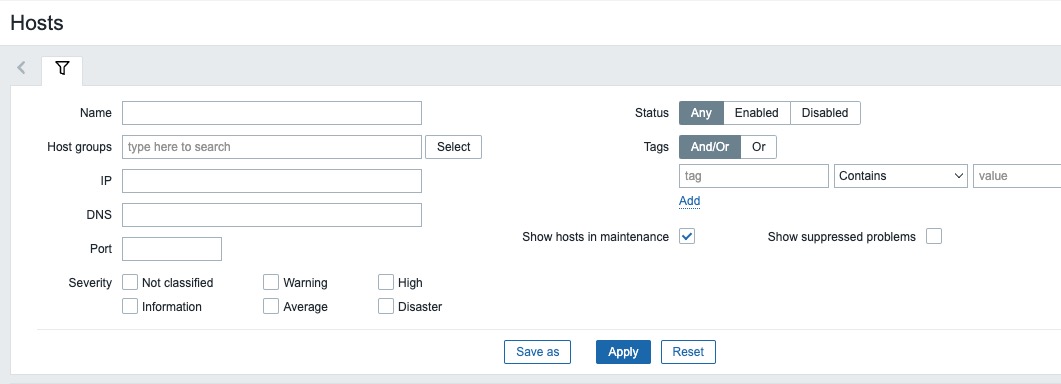
Hosts
Hosts section in Zabbix refers to the management and monitoring of individual hosts or devices in your infrastructure. It allows you to add, configure, and monitor various types of hosts such as servers, network devices, virtual machines, and more. You can view important information about each host, such as its status, availability, performance metrics, and any associated triggers or events. Additionally, you can set up specific monitoring parameters and actions for each host, enabling you to effectively monitor and manage your entire infrastructure. The Hosts section provides a centralized view of all your hosts, allowing you to quickly identify any issues or anomalies that require attention.
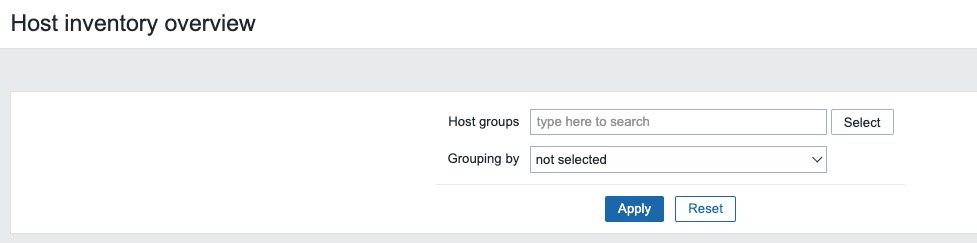
Host Inventory Overview
The Inventory section in Zabbix allows you to manage and track the inventory of your monitored hosts. It provides a centralized view of all the assets in your infrastructure, such as servers, network devices, and virtual machines. You can add, edit, and delete inventory items, as well as associate them with specific hosts. This helps you keep track of important information about your assets, such as their location, owner, purchase date, and warranty status. The Inventory section in Zabbix provides a comprehensive overview of your infrastructure's inventory, making it easier to manage and maintain your assets. It helps you organize and track your inventory effectively, enabling you to make informed decisions about your infrastructure.
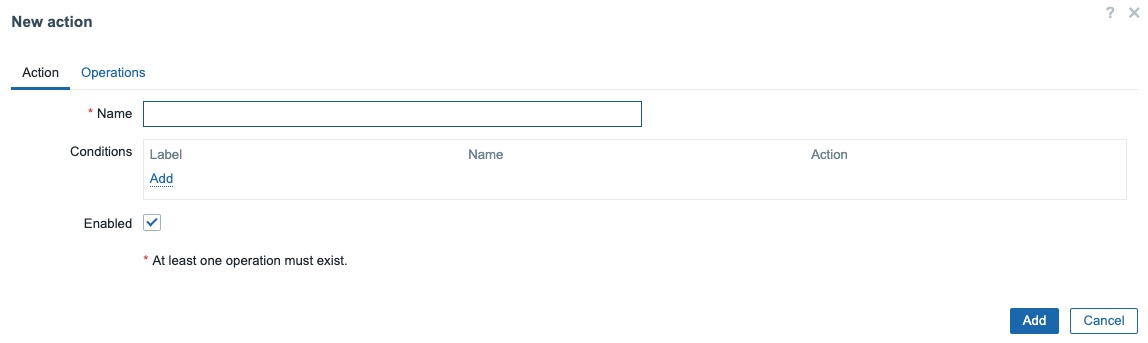
Action
The Action section in Zabbix allows you to define automated actions based on specific triggers or events. These actions can include sending notifications, executing remote commands, or performing other predefined operations. Actions help you automate the response to certain events, such as sending an email when a server goes down or restarting a service when a certain threshold is exceeded. They provide a way to proactively manage and resolve issues in your infrastructure. The Action section in Zabbix provides a visual interface for creating and managing actions, allowing you to define the conditions, operations, and notifications for each action. It helps you streamline your monitoring and response processes, ensuring that critical events are addressed promptly.
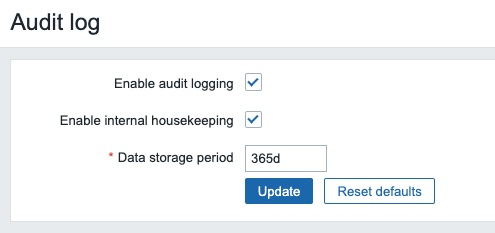
Audit Log
The Audit section in Zabbix provides a log of all actions performed within the system. It records events such as user logins, configuration changes, and other administrative activities. The audit log helps administrators track and monitor system activity, ensuring accountability and providing a historical record of changes made to the Zabbix environment. It is a valuable tool for troubleshooting, security analysis, and compliance purposes. The Audit section in Zabbix provides a detailed view of all system events, allowing you to review and analyze the activity within your monitoring environment. It helps you maintain visibility and control over your infrastructure, ensuring that all actions are logged and monitored.
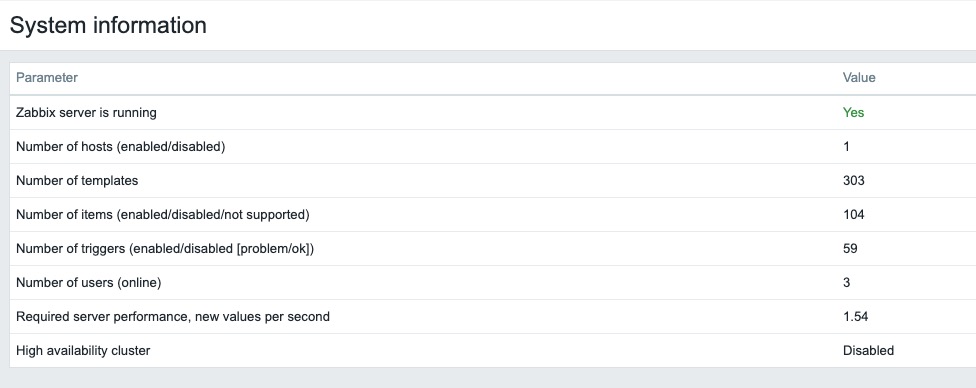
System Information
System Info section in Zabbix provides a summary of the overall system status and key performance metrics. It displays information such as the number of monitored hosts, the number of items, triggers, and events, the Zabbix server and database statistics, and other important system information. This section helps administrators quickly understand the health and performance of their Zabbix environment at a glance. It provides a centralized view of your monitoring infrastructure, making it easier to manage and maintain your system. The System Info section in Zabbix is a valuable resource for monitoring and troubleshooting, enabling you to identify and address any issues that may arise.
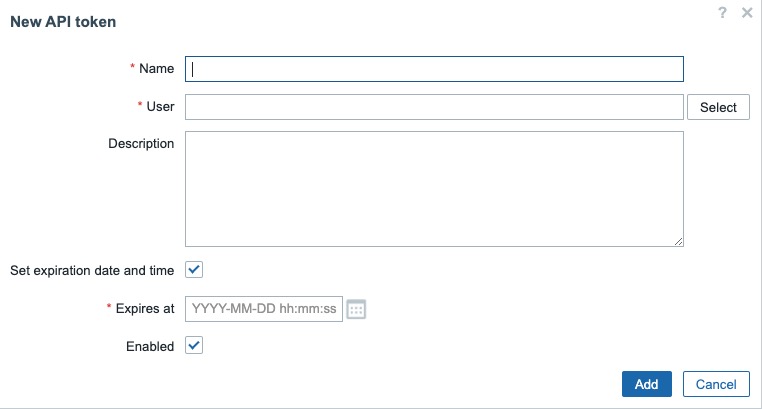
New API Token
API token is a unique identifier used to authenticate requests to the Zabbix API. It allows you to interact with the Zabbix server programmatically, without needing to provide your username and password for each request. This can be useful for automating tasks, integrating with other systems, or developing custom applications. The API token can be generated from the Zabbix user interface and must be included in the header of each API request. The API section in Zabbix provides options for managing and configuring API tokens, allowing you to securely interact with the Zabbix API. It helps you streamline your monitoring workflows and automate tasks using the Zabbix API.
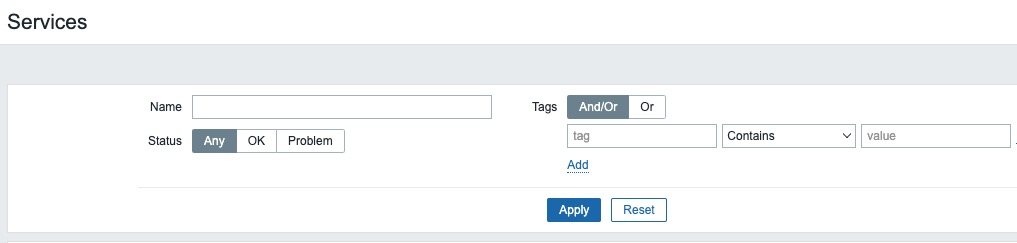
Services
The Services section in Zabbix allows you to monitor and manage the services running on your hosts. It provides information about the status, availability, and performance of each service. You can configure triggers and actions to be executed based on the service status, enabling you to proactively respond to any issues. The Services section in Zabbix provides a centralized view of all the services in your infrastructure, allowing you to quickly identify and resolve any service related problems. It helps you ensure that your services are running smoothly and efficiently.
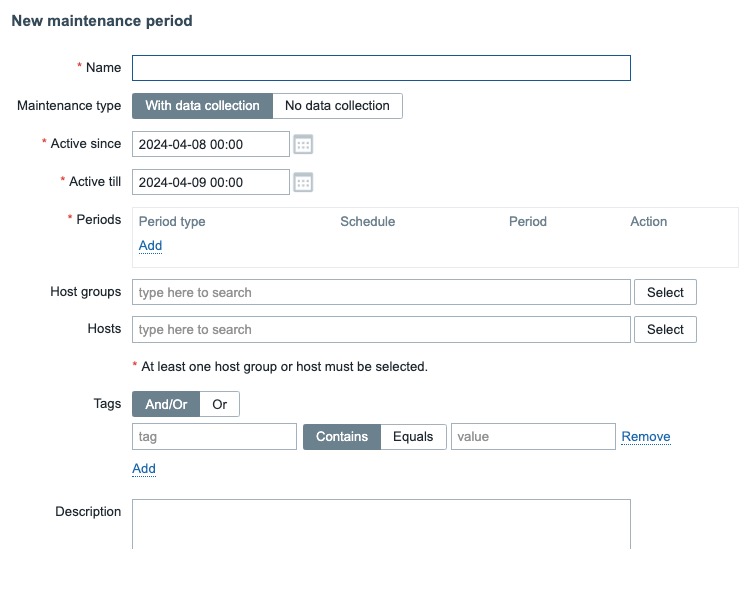
New Maintenance Period
The Maintenance section in Zabbix allows you to define periods during which certain hosts or groups of hosts are not monitored or have different monitoring settings. This is useful for times when you know that a system or service will be down, such as during scheduled maintenance or upgrades, and you don't want to receive false alarms. During a maintenance period, you can choose to either completely stop collecting data or collect data but not process triggers. The Maintenance screen in Zabbix provides an interface for creating and managing maintenance periods, allowing you to customize the start time, duration, and type of maintenance. It helps you ensure that your monitoring system is configured to handle planned downtime effectively.