KeyDB is an open source database solution used to handle large scale data storage and retrieval tasks efficiently. It offers users a scalable key value database with features for speed and reliability. With KeyDB, users can store and retrieve data using simple key-value pairs, making it ideal for fast access to large volumes of data.
Sign In
On your first visit to the site, you will be presented with the login/signup screen.
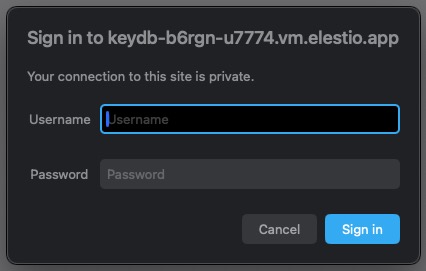
When your instance is first created, an account is created for you with the email you chose. You can get the password for this account by going to your Elestio dashboard and clicking on the "Show Password" button.
Enter your email, name and password and click the "Sign In" button
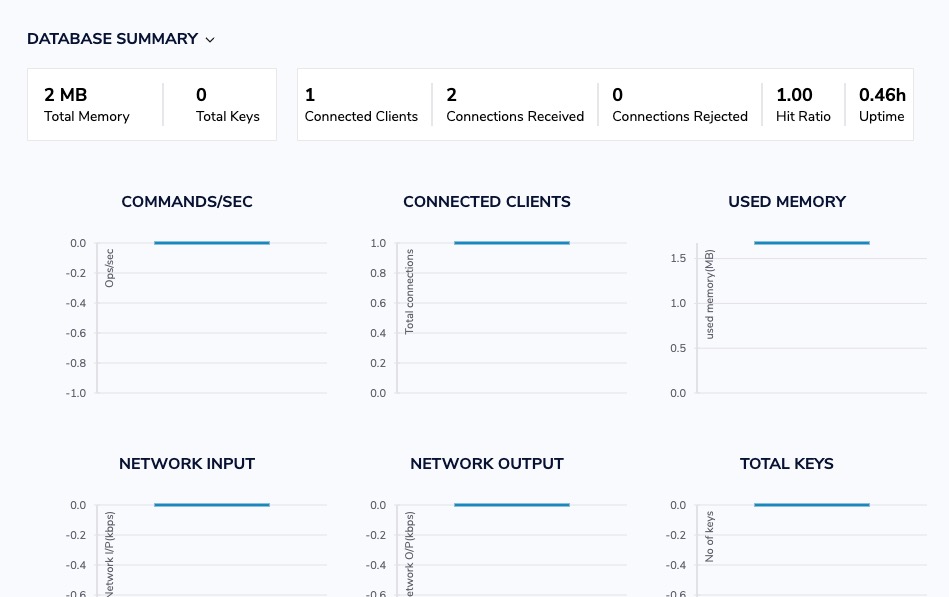
Database Summary
The database summary in KeyDB provides an overview of the database's key metrics and statistics. It includes information such as memory usage, client connections, streams, profiler data, and log information. The summary screen gives you a quick snapshot of the database's performance and status. You can view the summary of your database by clicking on the "Summary" tab.
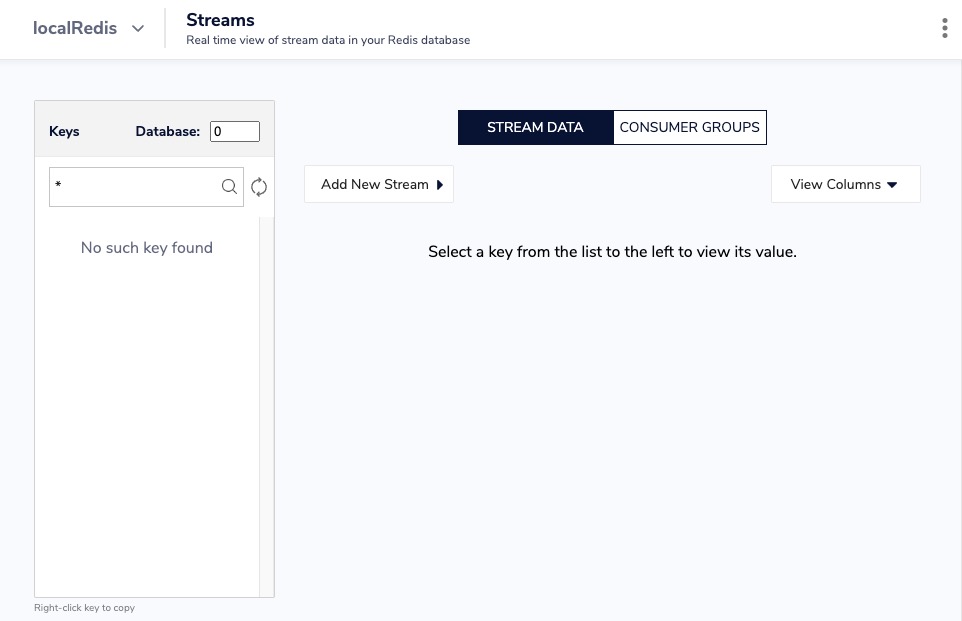
Streams
In KeyDB, streams are a data structure that allows you to store and consume real-time data in a time-ordered manner. Streams are similar to log files or message queues, where you can append new data and read it in the order it was added. They are useful for building applications that require processing and analyzing real-time data, such as chat applications, activity feeds, or event sourcing systems. The streams screen in KeyDB provides options to manage and monitor the streams in your database, such as creating new streams, adding data to streams, and reading data from streams. You can access the streams by clicking on the "Streams" tab.
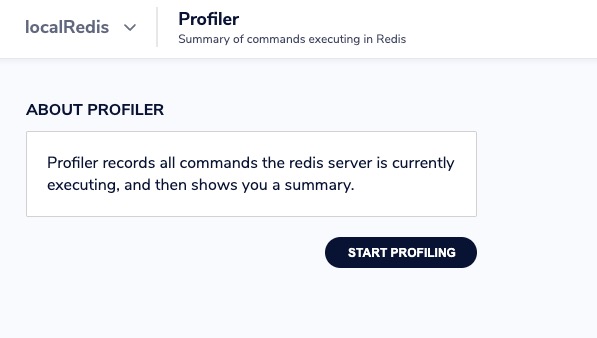
Profiler
Profiler allows you to monitor and analyze the performance of your database. It provides detailed information about the execution time and resource usage of various commands and operations. By enabling the profiler, you can identify bottlenecks and optimize your database's performance. The profiler screen in KeyDB displays the collected profiling data in a visual format, making it easier to analyze and troubleshoot any performance issues.
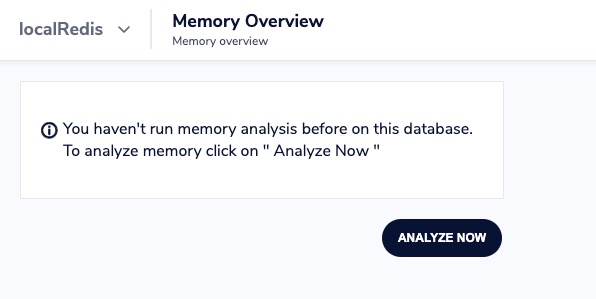
Memory Overview
The memory overview in KeyDB provides information about the memory usage of the database. It includes details such as the total memory allocated, memory used by data. This overview helps you understand how efficiently KeyDB is utilizing memory resources and allows you to optimize memory usage for better performance. You can view the memory overview by clicking on the "Memory > Memory Overview" tab. Additionally Click on "Analyze now" to get the memory analysis.
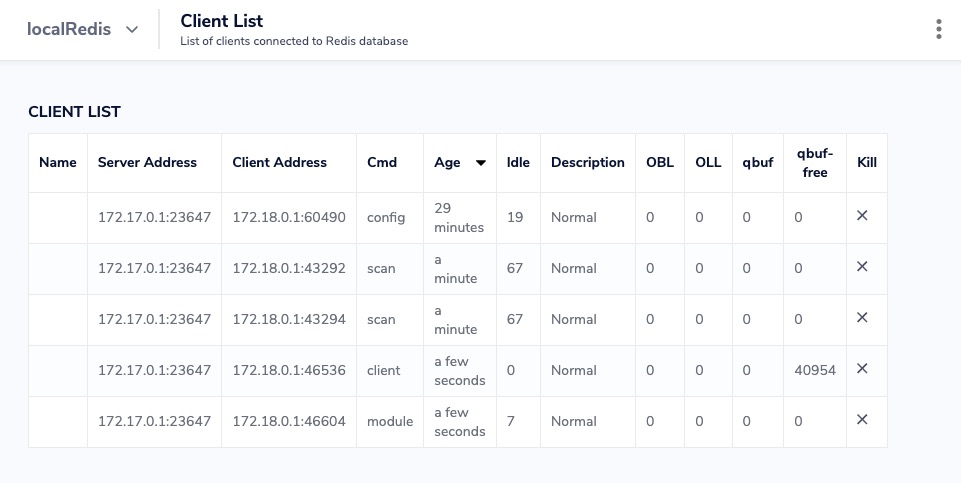
Client List
Client List provides information about the connected clients to the KeyDB server. It displays details such as the client's IP address, port number, connection type, and the current state of the client. The client list helps you monitor and manage the active connections to your KeyDB server, allowing you to identify and troubleshoot any issues related to client connections. You can view the client list by clicking on the "Client List" tab.
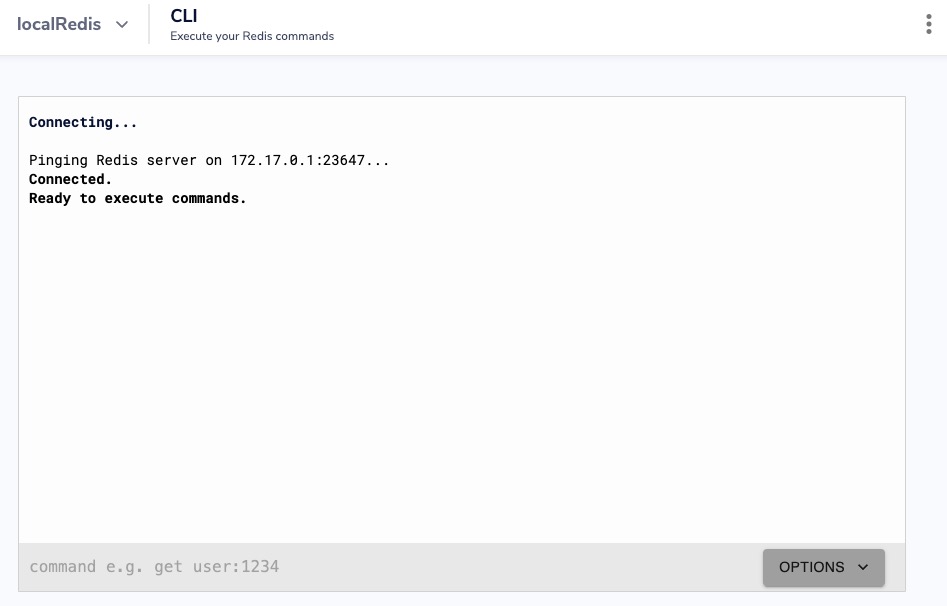
CLI
CLI stands for Command Line Interface. It is a tool that allows you to interact with the KeyDB server using commands entered through the command line. The CLI provides a way to manage and administer the KeyDB server, execute database operations, and perform various administrative tasks. It is commonly used for tasks such as data manipulation, configuration management, and monitoring the server's status. You can access the CLI by clicking on the "CLI" tab.
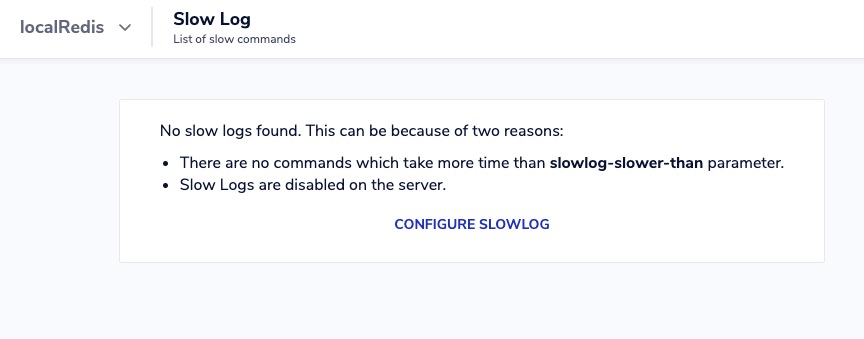
Slow Log
The slow log in KeyDB is a feature that records commands that exceed a certain execution time threshold. It helps identify slow queries or operations that may be impacting the performance of the database. The slow log captures details such as the command, execution time, and client information. It can be useful for troubleshooting and optimizing the performance of KeyDB. You can view the slow log by clicking on the "Slow Log" tab.